. 2023 Jan 4:9:1013262.
doi: 10.3389/fcvm.2022.1013262. eCollection 2022.

SARS-CoV-2 Spike protein activates TMEM16F-mediated platelet procoagulant activity

Affiliations

SARS-CoV-2 Spike protein activates TMEM16F-mediated platelet procoagulant activity

Ambra Cappelletto et al. Front Cardiovasc Med. .

Abstract

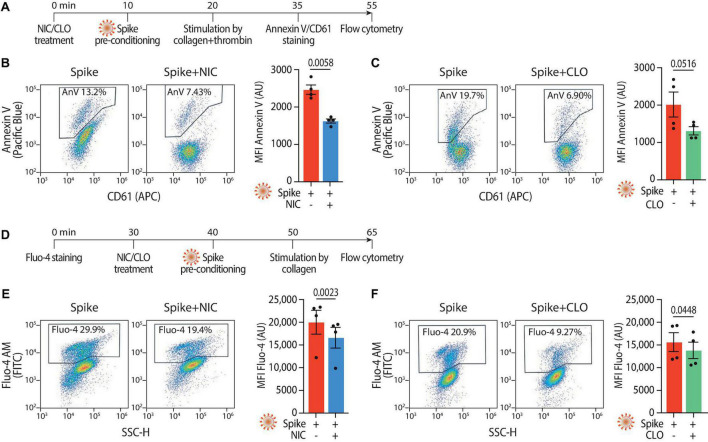
Thrombosis of the lung microvasculature is a characteristic of COVID-19 disease, which is observed in large excess compared to other forms of acute respiratory distress syndrome and thus suggests a trigger for thrombosis that is endogenous to the lung. Our recent work has shown that the SARS-CoV-2 Spike protein activates the cellular TMEM16F chloride channel and scramblase. Through a screening on >3,000 FDA/EMA approved drugs, we identified Niclosamide and Clofazimine as the most effective molecules at inhibiting Spike-induced TMEM16 activation. As TMEM16F plays an important role in stimulating the procoagulant activity of platelets, we investigated whether Spike directly affects platelet activation and pro-thrombotic function and tested the effect of Niclosamide and Clofazimine on these processes. Here we show that Spike, present either on the virion envelope or on the cell plasma membrane, promotes platelet activation, adhesion and spreading. Spike was active as a sole agonist or, even more effectively, by enhancing the function of known platelet activators. In particular, Spike-induced a marked procoagulant phenotype in platelets, by enhancing Ca2+ flux, phosphatidylserine externalization on the platelet outer cell membrane, and thrombin generation. Eventually, this increased thrombin-induced clot formation and retraction. Both Niclosamide and Clofazimine blocked this Spike-induced procoagulant response. These findings provide a pathogenic mechanism to explain lung thrombosis-associated with severe COVID-19 infection. We propose that Spike, present in SARS-CoV-2 virions or exposed on the surface of infected cells in the lungs, enhances the effects of inflammation and leads to local platelet stimulation and subsequent activation of the coagulation cascade. As platelet TMEM16F is central in this process, these findings reinforce the rationale of repurposing Niclosamide for COVID-19 therapy.

Keywords: COVID-19; Clofazimine; Niclosamide; SARS-CoV-2; Spike; TMEM16F; coagulation; platelets.


Conflict of interest statement

The authors declare that the research was conducted in the absence of any commercial or financial relationships that could be construed as a potential conflict of interest.

Figures

FIGURE 1
FIGURE 1
Spike enhances platelet activation. (A) Histopathological evidence of platelet aggregates in the thrombotic microvasculature of SARS-COV-2-infected lungs from four COVID-19 patients. Numeric codes identify patients. Platelets were stained using an anti-CD61 glycoprotein antibody. Scale bar: 100 μm. (B) Experimental scheme to study platelet activation and aggregate formation. Vero cells transfected to express either Green Fluorescent Protein (GFP) or SARS-CoV-2 Spike were incubated with pre-labeled washed platelets and shaken at 200 rpm for 10 min at 37°C. The plate was centrifuged, fixed, and stained with Cell Mask and antibodies recognizing either GFP or Spike. (C) Representative images showing platelet aggregates. Vero cells stained with Cell Mask are in blue; labeled platelets are in red; GFP or Spike are in green. Scale bar, 20 μm. (D) Number of aggregates larger than 40,000 px2. Results are from n = 3 independent experiments. Data are mean ± SEM, statistical significance is indicated (paired Student’s t-test). (E) Violin plot showing the size of the aggregates found in all the experiments performed. Statistical significance is indicated (unpaired Student’s t-test). (F) Experimental scheme for platelet activation in suspension. (G–I) Percentage of platelet aggregation when incubated with vehicle (G), stimulated with collagen (H) or CRP (I). Results are from N = 6 independent experiments. Data are mean ± SEM statistical significance is indicated (paired Student’s t-test). (J) Number of adherent platelets per field. Results are from n = 3 independent experiments each performed in duplicate. Each dot represents the mean of six images quantified. Data are mean ± SEM. Statistical significance is indicated (paired Student’s t-test). (K) Percentage of the area covered by adherent platelets. Results are from n = 3 independent experiments performed in duplicate; each dot represents the mean of six images quantified. (L) Representative images of platelets adhering on collagen. Images were acquired using a high content fluorescent microscope followed by analysis using the ImageJ software (Fiji). Platelets were stained with F-actin (in red). Scale bar, 5 μm.
FIGURE 2
FIGURE 2
Spikes activates the procoagulant activity of platelets. (A) Experimental scheme to study platelet activation by pseudovirions. Washed platelets were incubated with 1:10 diluted VSV-G or Spike for 10 min, followed by incubation with collagen (30 μg/ml) and thrombin (0.5 units) for 15 min. Platelets were stained with Annexin V-Pacific Blue and CD61-APC for 20 min at 37°C and then analyzed by flow cytometry. (B,C) Percentage and mean fluorescence intensity (MFI) of annexin V positive platelets upon activation with Spike or VSV-G pseudovirions. Results are from n = 4 independent experiments. Data are mean ± SEM. Statistical significance is indicated (paired Student’s t-test). AU, arbitrary units. (D) Representative flow cytometry plots. The boxed area shows the percentage of platelets positive for annexin V (AnV) binding following incubation with VSV-G or Spike. The histogram on the right shows the distribution of Annexin V positive platelets after the two treatments. For each flow cytometry plot, the first gating was based on CD61/FSC to define the platelet population. Thus, the Aneexin V plot excludes any microvesicles which may have been present within the sample. (E) Experimental scheme to study Ca2+ flux in platelets. Washed platelets were stained with Fluo-4 for 30 min, followed by incubation with VSV-G or Spike pseudovirions diluted 1:10 for 10 min. Platelet samples were then incubated with collagen (30 μg/ml) for 15 min and then analyzed by flow cytometry. (F) Mean fluorescence intensity (MFI) of Fluo-4 (AU, arbitrary units) in platelets stimulated with Spike or VSV-G pseudovirions. Results are from n = 4 independent experiments. Data are mean ± SEM. Statistical significance is indicated (paired Student’s t-test). (G) Representative flow cytometry plots. The boxed area shows the percentage of platelets positive for Fluo-4 fluorescence following incubation with VSV-G or Spike. The histogram on the right shows the distribution of Fluo-4 fluorescence after the two treatments. (H) Experimental scheme for the clot retraction assay following stimulation of platelets with Spike. PRP was supplemented with CaCl2 and 10 μl of whole blood, then incubated with 1:10 diluted VSV-G or Spike pseudoparticles, recombinant Spike or recombinant RBD (1 ng/mL) for 10 min at 37°C, followed by incubation with thrombin. Clot retraction was measured over 90 min, taking an image every 15 min. (I,K) Clot retraction of PRP pre-incubated with PBS, VSV-G or Spike pseudoparticles. Representative images immediately after the addition of thrombin and after 45 min are in panel (I), the percentage of clot retraction over a 90 min observation period is in panel (J). The graph in (K) shows the time to 50% clot retraction. All data are mean ± SEM from n = 5 independent experiments. Statistical significance is indicated in panel (K) (one-way ANOVA with Dunnett’s post-hoc correction for multiple comparisons). (L,M) Clot retraction of PRP pre-incubated with PBS, recombinant Spike (1 ng/mL) or recombinant receptor binding domain (RBD, 1 ng/mL). The percentage of clot retraction over the 90 min observation period is in panel (L). The graph in panel (M) shows the time to 50% clot retraction in the three experimental conditions. All data are mean ± SEM from n = 3 independent experiments. Statistical significance is indicated in panel (K) (one-way ANOVA with Dunnett’s post-hoc correction for multiple comparisons). (N) Experimental scheme to study thrombin generation upon platelet treatment with Spike pseudovirions. PRP was incubated with 1:10 diluted VSV-G or Spike pseudovirions for 10 min at 37°C, followed by stimulation with collagen (30 μg/mL) for 15 min (350 rpm, 37°C) and the addition of a fluorogenic thrombin substrate. Thrombin activity was assessed by measuring the conversion of thrombin substrate into its fluorogenic state using a CLARIOstar fluorescent plate reader with 350/450 nm excitation and emission filter. Analysis was performed using MARS analysis software. (O) Concentration of thrombin formed during a 30 min-time period. Results are from n = 5 independent experiments. Data are mean ± SEM.
FIGURE 3
FIGURE 3
Niclosamide and Clofazimine inhibits Spike-induced activation of platelets. (A) Experimental scheme to assess the effect of drugs on platelet activation. Washed platelets were incubated with Niclosamide, Clofazimine (C) or vehicle for 10 min, then incubated with 1:10 diluted Spike or VSV-G pseudoparticles for further 10 min. Aggregation and adhesion were evaluated as described in Figure 1. (B,C) Percentage of platelet aggregation upon treatment with Spike in the presence of either Niclosamide (B) or Clofazimine (C), and respective DMSO controls, with or without CRP. Results are from n = 3 independent experiments. Data are mean ± SEM. Statistical significance is indicated (paired Student’s t-test). (D) Representative images of platelets adhering on collagen (magnification in the right panels). Platelets are stained in red for F-actin. Scale bar, 5 μm. (E) Number of adherent platelets per field. Results are from n = 3 independent experiments performed in duplicate. Each dot represents the mean of six quantified images. Data are mean ± SEM. Statistical significance is indicated (unpaired Student’s t-test). (F) Representative images of platelet morphological changes. Adherent platelets were classified into four morphological categories representing different stages of platelet adhesion and activation: platelets with 0–1, 3–5, more than five protrusions or fully spread platelets, as indicated by the representative images under the graph. Scale: 1 μm. (G) Platelet morphological changes upon Spike and drug treatment. Results are from n = 3 independent experiments performed in duplicate. Data are mean ± SEM. Statistical significance is shown for the indicated morphological categories (one-way ANOVA with Dunnett’s post-hoc correction for multiple comparisons).
FIGURE 4
FIGURE 4
Niclosamide and Clofazimine reduce annexin V reactivity and intracellular calcium in platelets. (A) Experimental scheme to assess annexin V reactivity upon Spike stimulation and drug treatment. Platelets were pre-incubated with Niclosamide (NIC, 1 μM) or Clofazimine (CLO, 5 μM) for 10 min, followed by incubation with collagen (30 μg/ml) and thrombin (0.5 units) for 15 min. Platelets were then stained with Annexin V-Pacific Blue and CD61-APC and analyzed by flow cytometry. (B) Effect of Niclosamide on annexin V reactivity. Representative flow cytometry plots are on the left, quantification on the right. The boxed areas show the percentage of washed platelets positive for annexin V upon treatment with the drug or vehicle (DMSO at the same concentration and for the drug) and incubation with VSV-G or Spike pseudoparticles, followed by stimulation with collagen and thrombin. The graph shows the Mean fluorescence intensity (MFI) of annexin V positive platelets (AU, arbitrary units). Results are from n = 4 independent experiments. Data are mean ± SEM. Statistical significance is indicated (paired Student’s t-test). (C) Same as panel (B) upon treatment with Clofazimine. (D) Experimental scheme to assess Ca2+ influx upon Spike stimulation and drug treatment. Platelets were stained with Fluo-4 for 30 min and then pre-incubated with Niclosamide (NIC, 1 μM) or Clofazimine (CLO, 5 μM) for 10 min, followed by incubation with collagen (30 μg/ml) and thrombin (0.5 units) for 15 min. Platelets were then assessed for fluorescence by flow cytometry. (E) Representative flow cytometry plots are on the left, quantification on the right. The boxed areas show the percentage of washed platelets positive for Fluo-4 upon treatment with the drug or vehicle (DMSO at the same concentration and for the drug) and incubation with Spike pseudoparticles, followed by stimulation with collagen and thrombin. The graph shows the Mean fluorescence intensity (MFI) of Fluo-4 (AU, arbitrary units). Results are from n = 4 independent experiments and are expressed as mean ± SEM. Statistical significance is indicated (paired Student’s t-test). (F) Same as in panel (E) upon treatment with Clofazimine.
FIGURE 5
FIGURE 5
Niclosamide and Clofazimine block procoagulant activation of platelets. (A) Experimental scheme to study the effect of drugs on the clot retraction assay following stimulation of platelets with Spike. PRP, supplemented with CaCl2 and 10 μl of whole blood, were incubated with Niclosamide or Clofazimine for 10 min, then treated with 1:10 diluted VSV-G or Spike pseudoparticles for additional 10 min. Clot retraction was measured over 90 min from the addition of thrombin, taking an image every 15 min. (B,C) Representative images of clot retraction when platelets were treated with Spike and either Niclosamide (B) or Clofazimine (C), immediately after the addition of thrombin and after 45 min. (D,E) Percentage of clot retraction over 90 min, when platelets were treated with Spike and either Niclosamide (J) or Clofazimine (K). Results are from n = 4 independent experiments. Data are expressed as mean ± SEM. (F,G) Time to 50% clot retraction when platelets were treated with Spike and either Niclosamide (L) or Clofazimine (M). Results are from n = 4 independent experiments. Data are mean ± SEM. Statistical significance is shown (paired Student’s t-test). (H) Experimental scheme to study the effect of drugs on thrombin generation upon platelet treatment with Spike pseudovirions. PRP was incubated with 1:10 diluted VSV-G or Spike for 10 min at 37°C, followed by incubation with collagen (30 μg/mL) for 15 min and the addition of a fluorogenic thrombin substrate. Thrombin activity was assessed by the measurement of the conversion of the thrombin substrate into its fluorogenic state. (I,J) Concentration of thrombin formed during a 30 min-time period in PRP treated with Spike and pre-conditioned or not with Niclosamide or Clofazimine. Data are expressed as mean ± SEM.

References

    1. Xiong X, Chi J, Gao Q. Prevalence and risk factors of thrombotic events on patients with COVID-19: a systematic review and meta-analysis. Thromb J. (2021) 19:32. 10.1186/s12959-021-00284-9 - DOI - PMC - PubMed
    1. Jenner W, Gorog D. Incidence of thrombotic complications in COVID-19 : on behalf of ICODE: the international COVID-19 thrombosis biomarkers colloquium. J Thromb Thrombolysis. (2021) 52:999–1006. 10.1007/s11239-021-02475-7 - DOI - PMC - PubMed
    1. Zhang L, Yan X, Fan Q, Liu H, Liu X, Liu Z, et al. D-dimer levels on admission to predict in-hospital mortality in patients with Covid-19. J Thromb Haemost. (2020) 18:1324–9. 10.1111/jth.14859 - DOI - PMC - PubMed
    1. Lippi G, Favaloro E. D-dimer is associated with severity of coronavirus disease 2019: a pooled analysis. Thromb Haemost. (2020) 120:876–8. 10.1055/s-0040-1709650 - DOI - PMC - PubMed
    1. Chaudhary R, Garg J, Houghton DE, Murad MH, Kondur A, Chaudhary R, et al. Thromboinflammatory biomarkers in COVID-19: systematic review and meta-analysis of 17,052 patients. Mayo Clin Proc Innov Qual Outcomes. (2021) 5:388–402. 10.1016/j.mayocpiqo.2021.01.009 - DOI - PMC - PubMed