. 2023 Jan 4:13:1053669.
doi: 10.3389/fpls.2022.1053669. eCollection 2022.

Single-cell transcriptome sequencing atlas of cassava tuberous root

Affiliations

Single-cell transcriptome sequencing atlas of cassava tuberous root

Jinjia Song et al. Front Plant Sci. .

Abstract

Introduction: Single-cell transcriptome sequencing (ScRNA-seq) has emerged as an effective method for examining cell differentiation and development. In non-model plants, it hasn't been employed very much, especially in sink organs that are abundant in secondary metabolites.

Results: In this study, we sequenced the single-cell transcriptomes at two developmental phases of cassava tuberous roots using the technology known as 10x Genomics (S1, S2). In total, 14,566 cells were grouped into 15 different cell types, primarily based on the marker genes of model plants known to exist. In the pseudotime study, the cell differentiation trajectory was defined, and the difference in gene expression between the two stages on the pseudotime axis was compared. The differentiation process of the vascular tissue and cerebral tissue was identified by the trajectory. We discovered the rare cell type known as the casparian strip via the use of up-regulated genes and pseudotime analysis, and we explained how it differentiates from endodermis. The successful creation of a protoplast isolation technique for organs rich in starch was also described in our study.

Discussion: Together, we created the first high-resolution single-cell transcriptome atlas of cassava tuberous roots, which made significant advancements in our understanding of how these roots differentiate and develop.

Keywords: ScRNA-seq; casparian strip; cassava; differentiation trajectory; tuberous root.


Conflict of interest statement

The authors declare that the research was conducted in the absence of any commercial or financial relationships that could be construed as a potential conflict of interest.

Figures
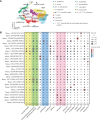
Figure 1
Figure 1
ScRNA-Seq and Identification of Cassava Cell Clusters. (A) Umap visualization of each cluster in the cassava tuberous root. Each dot indicates a single cell. Each color indicates a cell cluster. (B) Expression of genes associated with each cluster’s cell type. Dot size indicates the percentage of cells in the cluster that are expressing a particular gene, and color denotes expression across the cells in that cluster. PEROXIDASE 45 (PER45) was enriched in endodermis, GALACTINOL SYNTHASE 2 (GolS2) was enriched in exodermis, and 3-KETOACYL-CoA SYNTHASE 6 (CUT1) and FATTY ACYL-CoA REDUCTASE 3 (FAR3) were enriched in epidermis. CELLULOSE SYNTHASE A CATALYTIC SUBUNIT 8 (CESA8), XYLEM CYSTEINE PEPTIDASE 2 (XCP2) and PROTEIN IRREGULAR XYLEM 9 (IRX9) were enriched in metaxylem, PROTEIN SIAMESE-RELATED 5 (SMR5) was enriched in columella, B-BOX DOMAIN PROTEIN 31 (MIP1B), BIDIRECTIONAL AMINO-ACID TRANSPORTER 1 (BAT1) and NUCLEAR POLY(A) POLYMERASE 4 (PAPS4) were enriched in vascular bundle, CALCIUM-DEPENDENT PROTEIN KINASE 13 (CPK13), BASIC LEUCINE ZIPPER 9 (BZIP9) and TETRATRICOPEPTIDE REPEAT THIOREDOXIN-LIKE 1 (TTL1) were enriched in pericycle, and7-DEOXYLOGANETIC ACID GLUCOSYLTRANSFERASE (UGT709C2) and ASYMMETRIC LEAVES (AS) were enriched in internal phloem-associated parenchyma (IPAP). TONOPLAST INTRINSIC PROTEIN 1-1 (TIP1-1) and PLASMA MEMBEANE INTRINSIC PROTEIN 1-2 (PIP1-2) were enriched in xylem.
Figure 2
Figure 2
Differentiation Trajectory of the Xylem and Phloem. (A) Single-cell transcriptome data revealing the differentiation trajectory of xylem, phloem and procambium from S1 and S2 analyzed by Monocle 2. Each dot indicates a single cell. Different color on the dots indicates the pseudotime scores (B) Cell types labeled on the differentiation trajectory for S1 and S2, respectively. (C, D) Cell trajectory analysis of differentiation fate of xylem marker gene PIP1-2 (C) and phloem marker gene Manes_01G055100 (D) from S1 and S2. Each dot indicates a single cell. Color on the dots indicates the expression abundance in corresponding parts. (E) Heatmap showing the expression of the genes regulating significant enrichment function in three clusters across the pseudotime. Each row represents one gene. Scatter plots of representative GO terms for each cluster are shown on the right. The corresponding genes in the heatmap are listed in the supplementary table of CT roots.
Figure 3
Figure 3
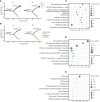
Differentiation Trajectory of Cartical Tissue. (A) Single-cell transcriptome data revealing the differentiation trajectory of cortical tissue and meristem from S1 and S2 analyzed by Monocle 2. Each dot indicates a single cell. Different color on the dots indicates the pseudotime scores. (B) Cell types labeled on the differentiation trajectory for S1 and S2, respectively. (C–E) Scatter plots of GO and KEGG enrichment analysis of up-regulated genes in exodermis (C), endodermis (D) and meristem (E) cell types after the aggregation of S1 and S2.
Figure 4
Figure 4
Differentiation Trajectory of Casparian strip. (A) Expression of significantly up-regulated genes in cluster 3 (endodermis) and cluster 8. Clusters 0 to 18 are classified according to cell-by-cell correlation. The cell types corresponding to each cluster are listed in the Supplemental Table 2 . The dot size indicates the fraction of cells in each cluster expressing a given gene, and the color indicates the level of signification up-regulated genes exhibit the preferential expression in corresponding cluster. (B) Pseudotime analysis using monocle 2 for single-cell transcriptome in the endodermis, xylem and casparian strip revealing the differentiation trajectory. Each dot indicates a single cell. Different color on the dots indicates the pseudotime score. (C) Cell types labeled on the differentiation trajectory for S1 and S2, respectively. (D) UMAP exhibition of 4 subclusters after the subcluster analysis of cluster 8. Each dot indicates a single cell. (E) Expression abundance of 4 subcluster of cluster 8. The dot size indicates the fraction of cells in each cluster expression the given gene, and the color denotes the level of marker genes exhibit the preferential expression in corresponding cluster.

Similar articles

Cited by

References

    1. Asada K., Salim V., Masada-Atsumi S., Edmunds E., Nagatoshi M., Terasaka K., et al. . (2013). A 7-deoxyloganetic acid glucosyltransferase contributes a key step in secologanin biosynthesis in Madagascar periwinkle. Plant Cell 25 (10), 4123–4134. doi: 10.1105/tpc.113.115154 - DOI - PMC - PubMed
    1. Barrieu F., Chaumont F., Chrispeels M. J. (1998). High expression of the tonoplast aquaporin ZmTIP1 in epidermal and conducting tissues of maize. Plant Physiol. 117 (4), 1153–1163. doi: 10.1104/pp.117.4.1153 - DOI - PMC - PubMed
    1. Bawa G., Liu Z., Yu X., Qin A., Sun X. (2022). Single-cell RNA sequencing for plant research: Insights and possible benefits. Int. J. Mol. Sci. 23 (9), 4497. doi: 10.3390/ijms23094497 - DOI - PMC - PubMed
    1. Becht E., McInnes L., Healy J., Dutertre C.-A., Kwok I. W., Ng L. G., et al. . (2019). Dimensionality reduction for visualizing single-cell data using UMAP. Nat. Biotechnol. 37 (1), 38–44. doi: 10.1038/nbt.4314 - DOI - PubMed
    1. Bonnett (1969). Cortical cell death during lateral root formation. J. Cell Biol. 40 (1), 144–159. doi: 10.1083/jcb.40.1.144 - DOI - PMC - PubMed

LinkOut - more resources