An integrated genomic and biochemical approach to investigate the potentiality of heirloom tomatoes: Breeding resources for food quality and sustainable agriculture
- PMID: 36684727
- PMCID: PMC9846345
- DOI: 10.3389/fpls.2022.1031776
An integrated genomic and biochemical approach to investigate the potentiality of heirloom tomatoes: Breeding resources for food quality and sustainable agriculture
Abstract
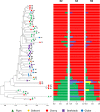
A revival of interest in traditional varieties reflects the change in consumer preferences and the greater awareness of the quality of locally grown products. As ancient cultivars, heirlooms have been selected for decades in specific habitats and represent nowadays potential germplasm sources to consider for breeding high-quality products and cultivation in sustainable agriculture. In this study, 60 heirloom tomato (Solanum lycopersicum L.) accessions, including diverse varietal types (beefsteak, globe, oxheart, plum, and cherry), were profiled over two seasons for the main chemical and biochemical fruit traits. A medium-high level of heritability was found for all traits ranging from 0.52 for soluble solids to 0.99 for fruit weight. The average content of ascorbic acid was ~31 mg 100 g-1 of fw in both seasons, while the greatest variability was found for carotenoids with peaks of 245.65 μg g-1 of fw for total lycopene and 32.29 μg g-1 of fw for β-carotene. Dissection of genotypic (G) and seasonal (Y) factors highlighted genotype as the main source of variation for all traits. No significant effect of Y and G × Y was found for ascorbic acid and fruit weight, respectively, whereas a high influence of Y was found on the variation of lycopene. Molecular fingerprinting was performed using the 10K SolCAP array, yielding a total of 7,591 SNPs. Population structure, phylogenetic relationships, and principal components analysis highlighted a differentiation of plum and cherry genotypes with respect to the beefsteak and globe types. These results were confirmed by multivariate analysis of phenotypic traits, shedding light on how breeding and selection focused on fruit characteristics have influenced the genetic and phenotypic makeup of heirlooms. Marker-trait association showed 11 significantly associated loci for β-carotene and fruit weight. For β-carotene, a single variant on chromosome 8 was found at 12 kb to CCD8, a cleavage dioxygenase playing a key role in the biosynthesis of apocarotenoids. For fruit weight, a single association was located at less than 3 Mbp from SLSUN31 and fw11.3, two candidates involved in the increasing of fruit mass. These results highlight the potentiality of heirlooms for genetic improvement and candidate gene identification.
Keywords: SNP array; breeding; carotenoids; genotype × year interaction; population structure; quality; tomato heirlooms; vitamin C.
Copyright © 2023 Tripodi, D’Alessandro and Francese.
Conflict of interest statement
The authors declare that the research was conducted in the absence of any commercial or financial relationships that could be construed as a potential conflict of interest.
Figures


Similar articles
-
Genome wide association mapping for agronomic, fruit quality, and root architectural traits in tomato under organic farming conditions.BMC Plant Biol. 2021 Oct 22;21(1):481. doi: 10.1186/s12870-021-03271-4. BMC Plant Biol. 2021. PMID: 34686145 Free PMC article.
-
Evaluation of the genotype, environment and their interaction on carotenoid and ascorbic acid accumulation in tomato germplasm.J Sci Food Agric. 2011 Apr;91(6):1014-21. doi: 10.1002/jsfa.4276. Epub 2011 Feb 15. J Sci Food Agric. 2011. PMID: 21328350
-
Genotypic variability for antioxidant and quality parameters among tomato cultivars, hybrids, cherry tomatoes and wild species.J Sci Food Agric. 2014 Mar 30;94(5):993-9. doi: 10.1002/jsfa.6359. Epub 2013 Sep 30. J Sci Food Agric. 2014. PMID: 24037905
-
Genotypic variation in tomatoes affecting processing and antioxidant attributes.Crit Rev Food Sci Nutr. 2015;55(13):1819-35. doi: 10.1080/10408398.2012.710278. Crit Rev Food Sci Nutr. 2015. PMID: 24279355 Review.
-
Use of Natural Diversity and Biotechnology to Increase the Quality and Nutritional Content of Tomato and Grape.Front Plant Sci. 2017 May 12;8:652. doi: 10.3389/fpls.2017.00652. eCollection 2017. Front Plant Sci. 2017. PMID: 28553296 Free PMC article. Review.
Cited by
-
Deleterious Effects of Heat Stress on the Tomato, Its Innate Responses, and Potential Preventive Strategies in the Realm of Emerging Technologies.Metabolites. 2024 May 15;14(5):283. doi: 10.3390/metabo14050283. Metabolites. 2024. PMID: 38786760 Free PMC article. Review.
-
Dissecting the genetic diversity of cultivated tomato (Solanum lycopersicum) germplasm resources: a comparison of ddRADseq genotyping and microsatellite analysis via capillary electrophoresis and high-resolution melting.3 Biotech. 2024 Dec;14(12):296. doi: 10.1007/s13205-024-04141-0. Epub 2024 Nov 9. 3 Biotech. 2024. PMID: 39529807
-
A Comparative Analysis of XGBoost and Neural Network Models for Predicting Some Tomato Fruit Quality Traits from Environmental and Meteorological Data.Plants (Basel). 2024 Mar 6;13(5):746. doi: 10.3390/plants13050746. Plants (Basel). 2024. PMID: 38475592 Free PMC article.
References
-
- Adalid A. M., Roselló S., Nuez F. (2010). Evaluation and selection of tomato accessions (Solanum section lycopersicon) for content of lycopene, β-carotene and ascorbic acid. J. Food Compos. Anal. 23, 613–618. doi: 10.1016/j.jfca.2010.03.001 - DOI
LinkOut - more resources
Full Text Sources
Research Materials
Miscellaneous

