

Large-scale analyses of angiosperm Flowering Locus T genes reveal duplication and functional divergence in monocots
- PMID: 36684773
- PMCID: PMC9847362
- DOI: 10.3389/fpls.2022.1039500
Large-scale analyses of angiosperm Flowering Locus T genes reveal duplication and functional divergence in monocots
Abstract
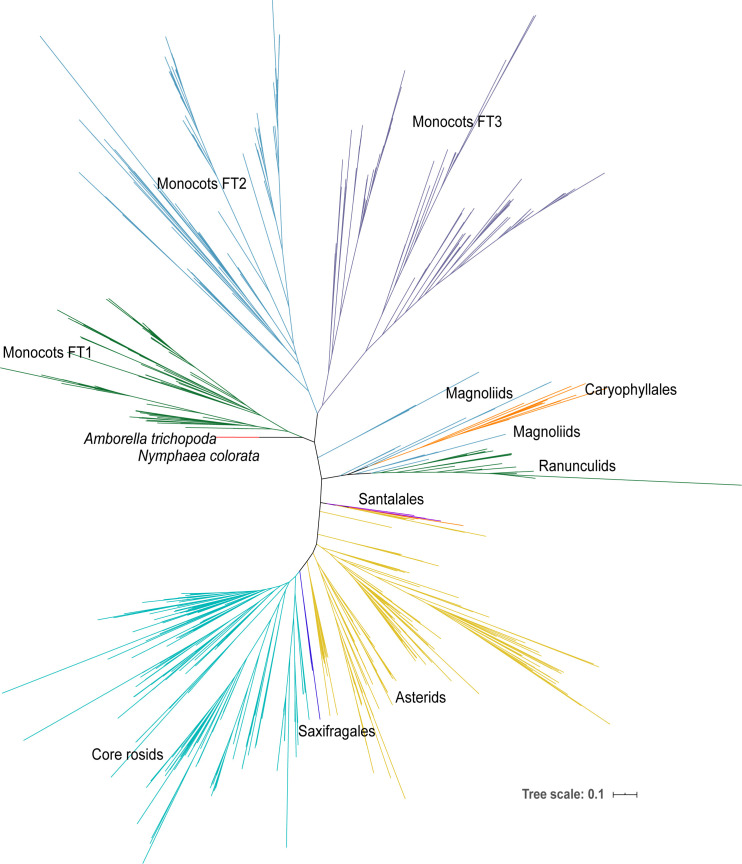
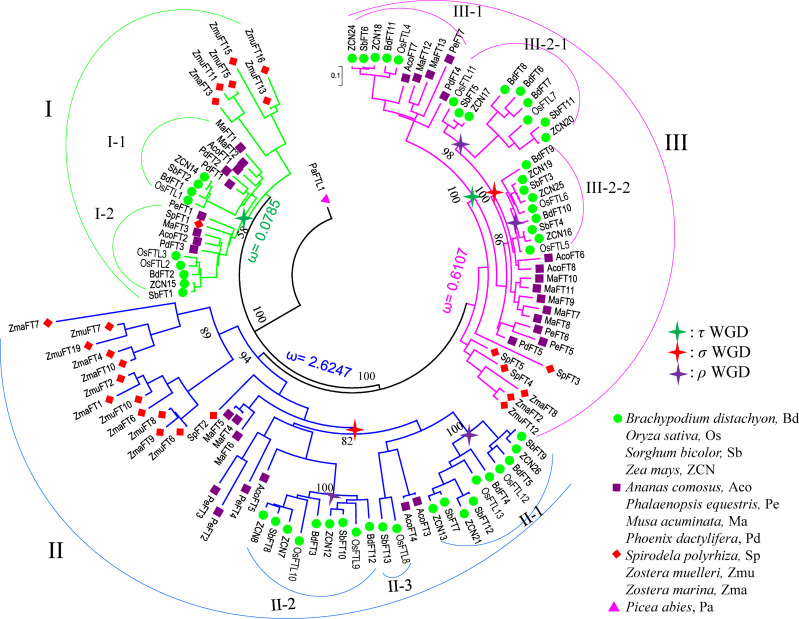
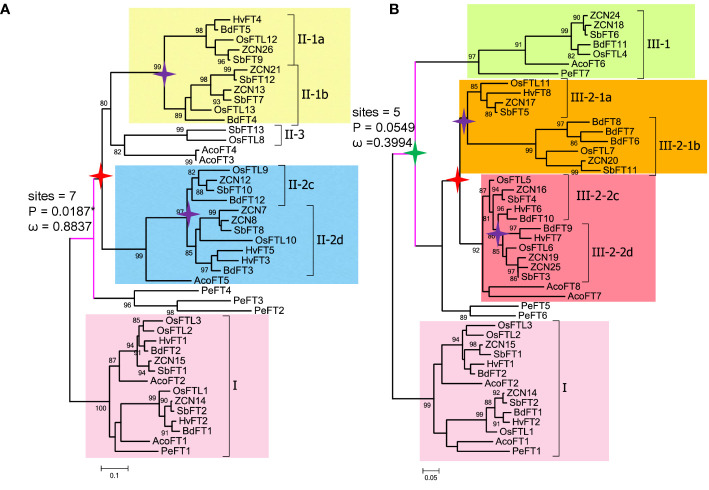
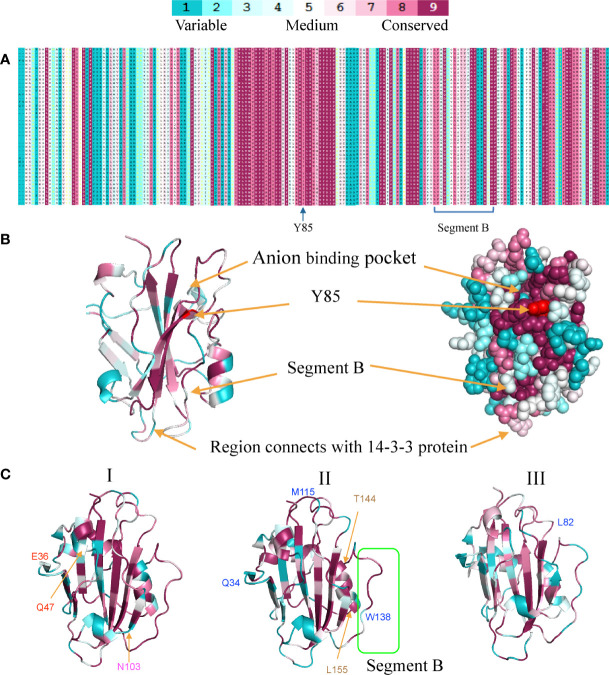
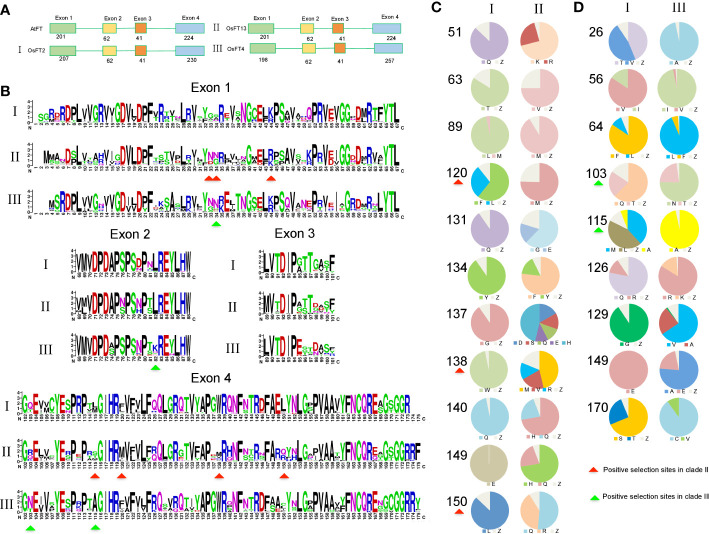
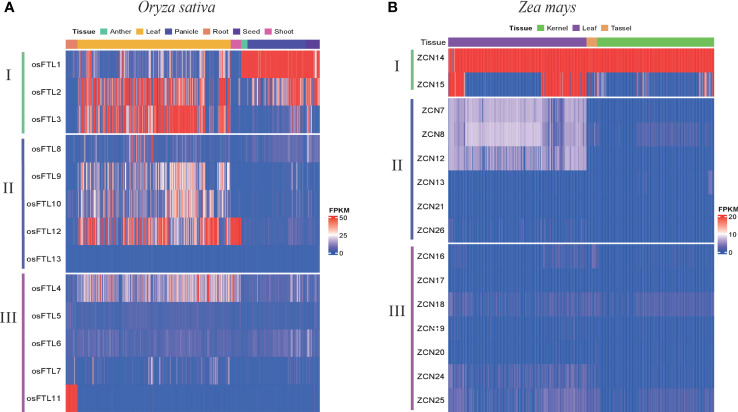
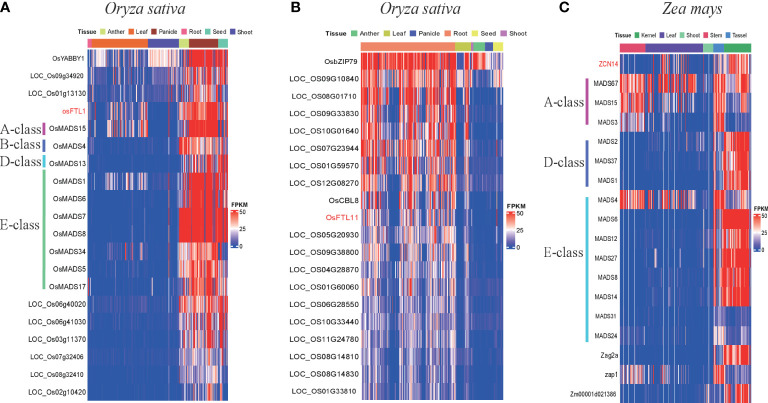
FLOWERING LOCUS T (FT) are well-known key genes for initiating flowering in plants. Delineating the evolutionary history and functional diversity of FT genes is important for understanding the diversification of flowering time and how plants adapt to the changing surroundings. We performed a comprehensive phylogenetic analysis of FT genes in 47 sequenced flowering plants and the 1,000 Plant Transcriptomes (1KP) database with a focus on monocots, especially cereals. We revealed the evolutionary history of FT genes. The FT genes in monocots can be divided into three clades (I, II, and III), whereas only one monophyletic group was detected in early angiosperms, magnoliids, and eudicots. Multiple rounds of whole-genome duplications (WGD) events followed by gene retention contributed to the expansion and variation of FT genes in monocots. Amino acid sites in the clade II and III genes were preferentially under high positive selection, and some sites located in vital domain regions are known to change functions when mutated. Clade II and clade III genes exhibited high variability in important regions and functional divergence compared with clade I genes; thus, clade I is more conserved than clade II and III. Genes in clade I displayed higher expression levels in studied organs and tissues than the clade II and III genes. The co-expression modules showed that some of the FT genes might have experienced neofunctionalization and subfunctionalization, such as the acquisition of environmental resistance. Overall, FT genes in monocots might form three clades by the ancient gene duplication, and each clade was subsequently subjected to different selection pressures and amino acid substitutions, which eventually led to different expression patterns and functional diversification. Our study provides a global picture of FT genes' evolution in monocots, paving a road for investigating FT genes' function in future.
Keywords: Flowering locus T (FT); functional divergence; gene duplication; monocots; positive selection.
Copyright © 2023 Liu, Liu, Chang, Chen, Lin and Zhang.
Conflict of interest statement
The authors declare that the research was conducted in the absence of any commercial or financial relationships that could be construed as a potential conflict of interest.
Figures
Similar articles
-
Asymmetric expansions of FT and TFL1 lineages characterize differential evolution of the EuPEBP family in the major angiosperm lineages.BMC Biol. 2021 Aug 31;19(1):181. doi: 10.1186/s12915-021-01128-8. BMC Biol. 2021. PMID: 34465318 Free PMC article.
-
Beyond the trinity: unraveling a fourth clade in the PEBP gene family in plants.Plant Cell Rep. 2025 May 18;44(6):122. doi: 10.1007/s00299-025-03505-x. Plant Cell Rep. 2025. PMID: 40383720
-
Revisiting the phosphatidylethanolamine-binding protein (PEBP) gene family reveals cryptic FLOWERING LOCUS T gene homologs in gymnosperms and sheds new light on functional evolution.New Phytol. 2016 Nov;212(3):730-744. doi: 10.1111/nph.14066. Epub 2016 Jul 4. New Phytol. 2016. PMID: 27375201
-
The ancient wave of polyploidization events in flowering plants and their facilitated adaptation to environmental stress.Plant Cell Environ. 2020 Dec;43(12):2847-2856. doi: 10.1111/pce.13898. Epub 2020 Oct 13. Plant Cell Environ. 2020. PMID: 33001478 Review.
-
The major clades of MADS-box genes and their role in the development and evolution of flowering plants.Mol Phylogenet Evol. 2003 Dec;29(3):464-89. doi: 10.1016/s1055-7903(03)00207-0. Mol Phylogenet Evol. 2003. PMID: 14615187 Review.
Cited by
-
Advances in virus-induced flowering in tomato.J Exp Bot. 2024 Jan 1;75(1):1-4. doi: 10.1093/jxb/erad407. J Exp Bot. 2024. PMID: 38128901 Free PMC article.
-
Insight from expression profiles of FT orthologs in plants: conserved photoperiodic transcriptional regulatory mechanisms.Front Plant Sci. 2024 Jun 3;15:1397714. doi: 10.3389/fpls.2024.1397714. eCollection 2024. Front Plant Sci. 2024. PMID: 38887456 Free PMC article. Review.
-
Florigen and antiflorigen gene expression correlates with reproductive state in a marine angiosperm, Zostera marina.bioRxiv [Preprint]. 2024 Nov 11:2024.11.09.622789. doi: 10.1101/2024.11.09.622789. bioRxiv. 2024. Update in: iScience. 2025 Jul 08;28(8):113082. doi: 10.1016/j.isci.2025.113082. PMID: 39605329 Free PMC article. Updated. Preprint.
-
Florigen and antiflorigen gene expression correlates with reproductive state in a marine angiosperm, Zostera marina.iScience. 2025 Jul 8;28(8):113082. doi: 10.1016/j.isci.2025.113082. eCollection 2025 Aug 15. iScience. 2025. PMID: 40740502 Free PMC article.
References
-
- Ben Michael T. E., Faigenboim A., Shemesh-Mayer E., Forer I., Gershberg C., Shafran H., et al. (2020). Crosstalk in the darkness: bulb vernalization activates meristem transition via circadian rhythm and photoperiodic pathway. BMC Plant Biol. 20 (1), 77. doi: 10.1186/s12870-020-2269-x - DOI - PMC - PubMed
-
- Bielawski J. P., Yang Z. (2005). “Maximum likelihood methods for detecting adaptive protein evolution,” in Statistical methods in molecular evolution (New York: Springer Science; ), 103–124.
LinkOut - more resources
Full Text Sources