. 2023 Jan 4;26(2):105923.
doi: 10.1016/j.isci.2022.105923. eCollection 2023 Feb 17.

Streptococcus pneumoniae promotes lung cancer development and progression

Affiliations

Streptococcus pneumoniae promotes lung cancer development and progression

Ning Li et al. iScience. .

Abstract

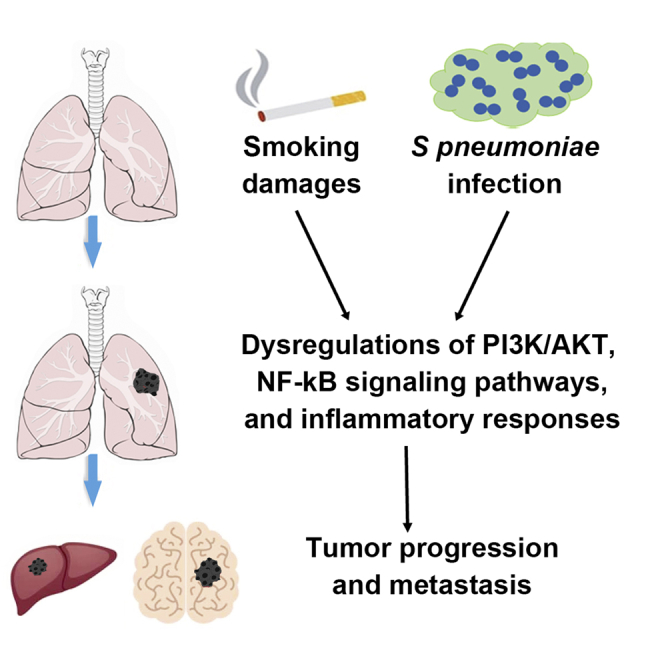
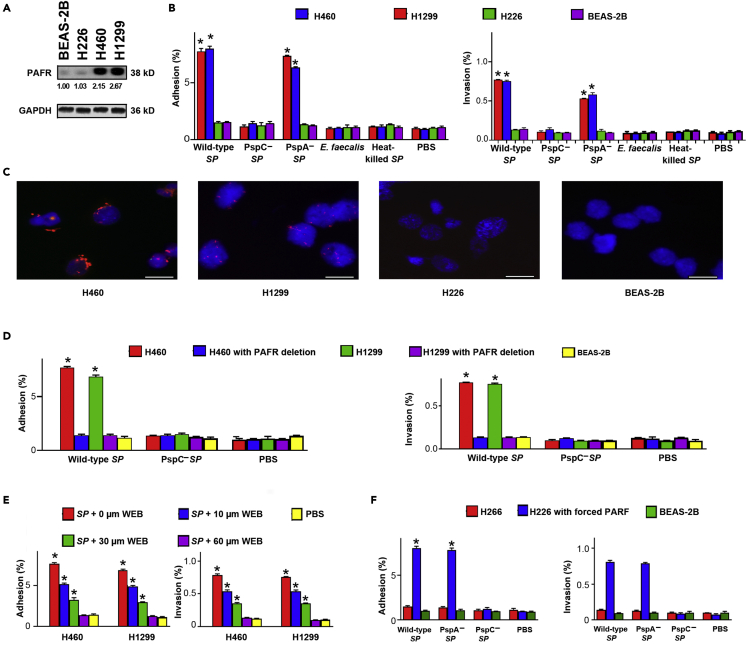
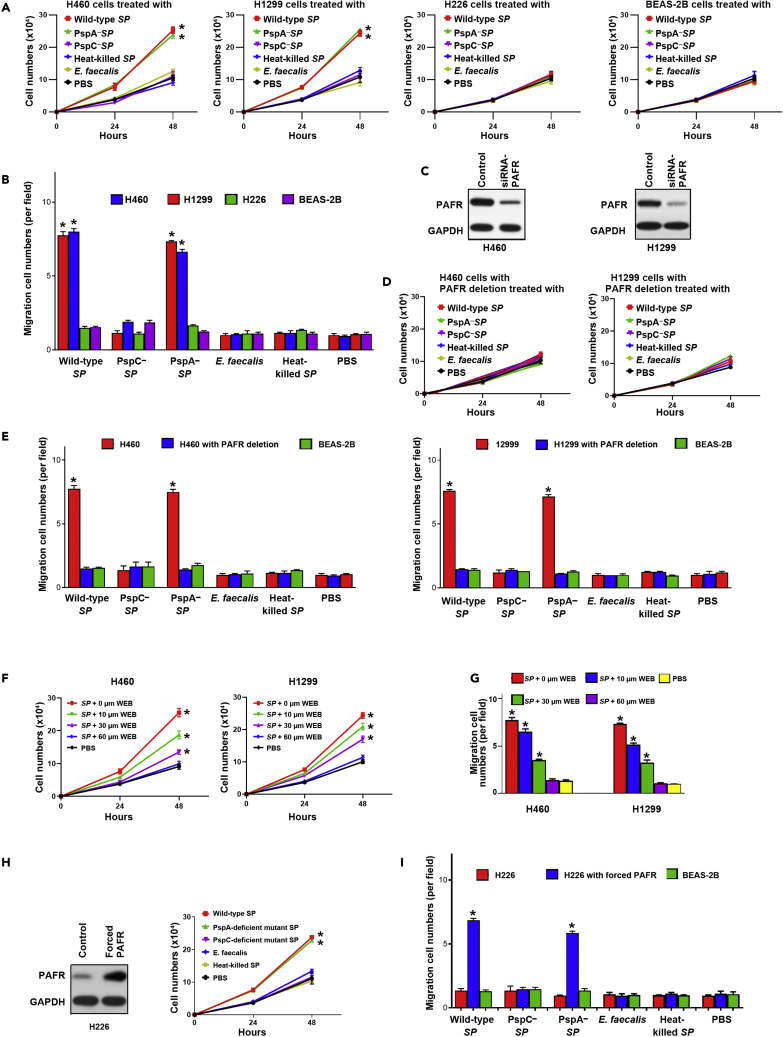
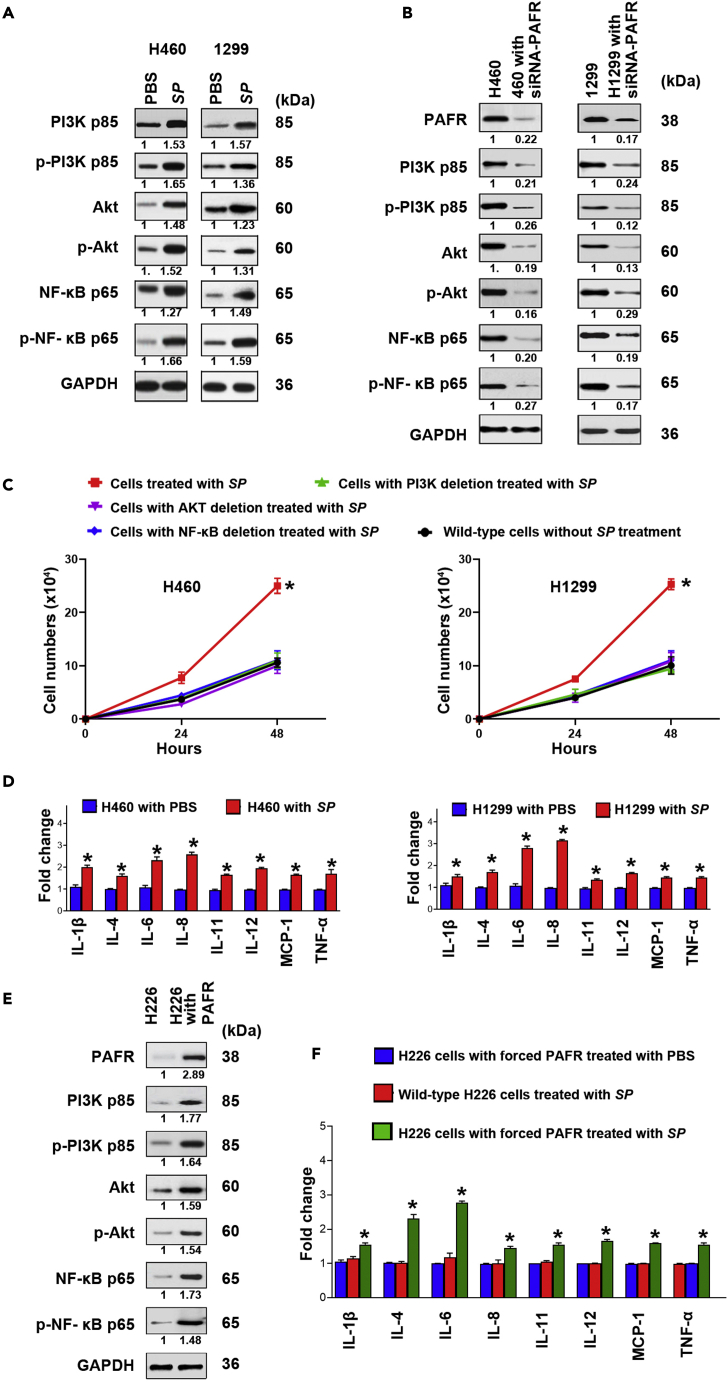
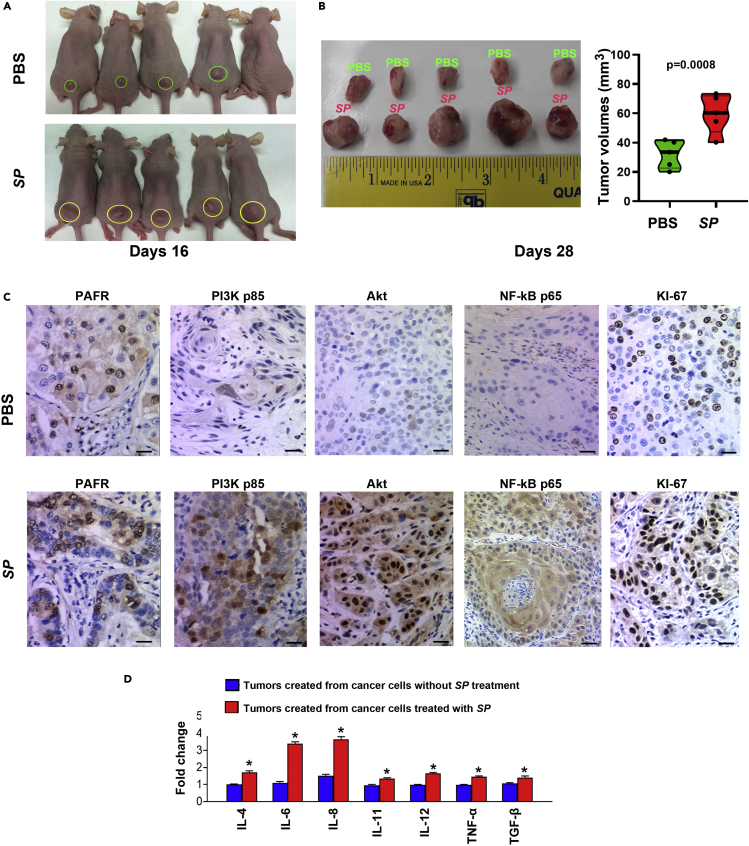
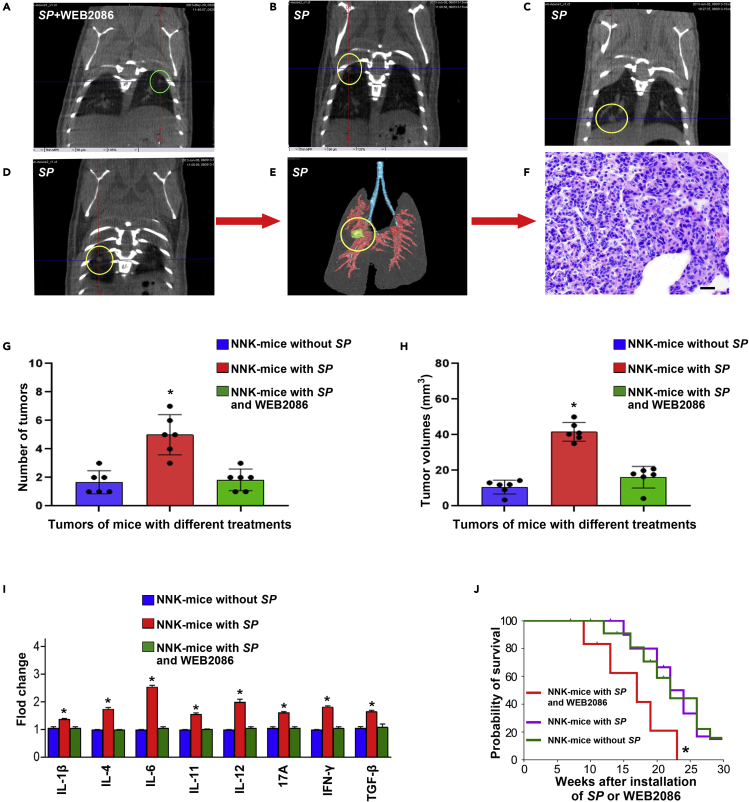
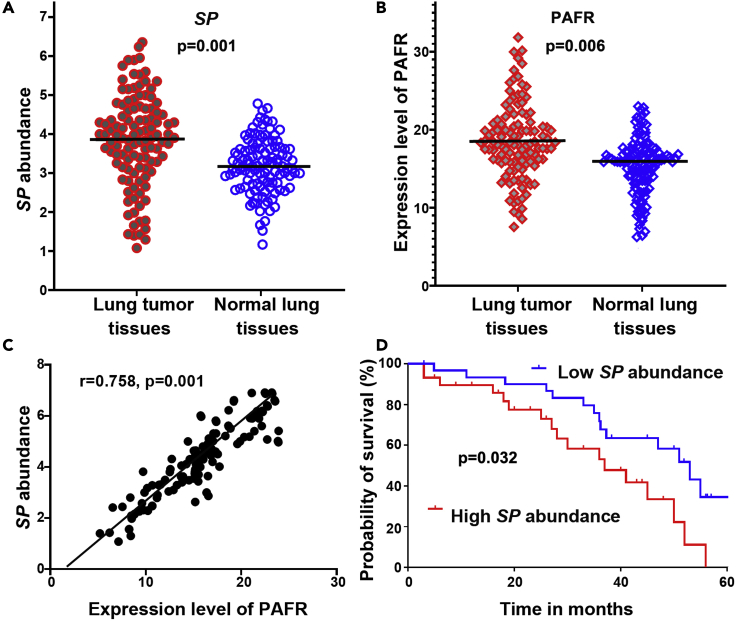
Streptococcus pneumoniae (SP) is associated with lung cancer, yet its role in the tumorigenesis remains uncertain. Herein we find that SP attaches to lung cancer cells via binding pneumococcal surface protein C (PspC) to platelet-activating factor receptor (PAFR). Interaction between PspC and PAFR stimulates cell proliferation and activates PI3K/AKT and nuclear factor kB (NF-kB) signaling pathways, which trigger a pro-inflammatory response. Lung cancer cells infected with SP form larger tumors in BALB/C mice compared to untreated cells. Mice treated with tobacco carcinogen and SP develop more lung tumors and had shorter survival period than mice treated with the carcinogen alone. Mutating PspC or PAFR abolishes tumor-promoting effects of SP. Overabundance of SP is associated with the survival. SP may play a driving role in lung tumorigenesis by activating PI3K/AKT and NF-kB pathways via binding PspC to PAFR and provide a microbial target for diagnosis and treatment of the disease.

Keywords: Bacteriology; Cancer systems biology; Cell; Cell biology.


Conflict of interest statement

The authors declare no competing interests.

Figures

None
Graphical abstract
Figure 1
Figure 1
SP attaches to and invades lung cancer cells via binding PspC to PAFR (A) PAFR expression was determined in cancer cell lines (H226, H460, and H1299) and a normal lung epithelial cell line (BEAS-2B) by Western blot. GAPDH was used as the loading control. Band intensity was determined by using ImageJ, and the ratio of each band was normalized to the corresponding GAPDH and shown below each band. H460 and H1299 cells had a higher level of PAFR expression compared with H226 cells and BEAS-2B cells. Data presented as mean ± SEM (n = 3); ∗p < 0.01 by one-way ANOVA. (B) SP adhered to and invaded the PAFR-expressing cells (H226 and H1299). Bacteria were added to cells at a multiplicity of infection (MOI) of 10 for 1 h. The PspC-deficient mutant SP and heat-killed SP were defective for attachment and invasion compared to wild-type SP and the PspA-deficient mutant SP. E. faecalis did not attach to and invade lung cancer cells. Cells treated with PBS were used as negative controls. Data presented as mean ± SEM (n = 3); ∗p < 0.01 by one-way ANOVA. (C) FISH analysis of SP using an Alexa Fluor 594-conjugated specific probe (Red) to SP. 4′,6-diamidino-2-phenylindole (DAPI) was used to visualize nuclear DNA of cells. Original magnification, X400. Three independent experiments were performed with consistent results. H460 and H1299 cells showed positive staining for SP (Red signals). Scale bar, 10 μm. (D) The depletion of PAFR in H460 and H1299 cells by using siRNA reduced attachment and invasion of SP. Data presented as mean ± SEM (n = 3); ∗p < 0.01 by one-way ANOVA. (E) The PAFR inhibitor, WEB2086, suppressed attachment and invasion of SP to H460 and H1299 cells in a dose-dependent manner (10, 30, and 60 μM and 1,000 μM WEB2086 were used). ∗p < 0.01. (F) Enforced expression of PAFR in H226 cells increased attachment and invasion of wild-type SP and PspA-deficient mutant SP, but not PspC-deficient mutant SP. All the results are presented as the mean ± SD of three different experiments with triplicates. Data presented as mean ± SEM (n = 3); ∗p < 0.01 by one-way ANOVA.
Figure 2
Figure 2
SP promotes the tumorigenicity of lung cancer by integrating PspC and PAFR (A) Wild-type and PspA-deficient mutant SPs stimulated proliferation of PAFR-expressing lung cancer cells (H460 and H1299) compared to untreated cells or those incubated with PspC-deficient mutant SP, heat-killed SP, and E. faecalis. Cells were incubated with bacteria at an MOI of 1000:1 for up to 48 h. Data presented as mean ± SEM (n = 3); ∗p < 0.01 by one-way ANOVA. (B) Wild-type and PspA-deficient mutant SPs promoted migration of PAFR-expressing lung cancer cells, compared to untreated cells or those incubated with PspC-deficient mutant SP, heat-killed SP, and E. faecalis after 48-h treatment. Data presented as mean ± SEM (n = 3); ∗p < 0.01 by one-way ANOVA. (C) siRNA was used to deplete PAFR in PAFR-expressing lung cancer cells, H460, and H1299 cells. Western blots showed that PAFR expression level was effectively reduced. (D) SP-stimulated cell proliferation was inhibited by the depletion of PAFR in H460 and H1299 cells. Left panel showed the results of H460 cells with depletion of PAFR that were treated differently. Right panel displayed the results of H1299 cells with depletion of PAFR that were treated differently. (E) SP-stimulated cell migration was suppressed by the depletion of PAFR in H460 and H1299. Data presented as mean ± SEM (n = 3); ∗p < 0.01 by one-way ANOVA. Red columns showed the results of H460 or H1299 cancer cells without depletion of PAFR. Blue columns indicated the results of H460 or H1299 cancer cells with depletion of PAFR. The depletion of PAFR in H460 and H1299 cancer cells decreased the effect of SP on cell migration. (F) SP-stimulated cell proliferation of H460 and H1299 cells was inhibited by the PAFR inhibitor, WEB2086 (WEB), in a dose-dependent manner. Data presented as mean ± SEM (n = 3); ∗p < 0.01 by one-way ANOVA. (G) SP-stimulated cell migration of H460 and H1299 was inhibited by WEB2086. (H) H226 cells were forced to overexpress PAFR by using a PAFR-overexpressing plasmid. A vector expressing sequence lacking homology to the human genome databases was used as a control. SP-stimulated cell proliferation was elevated by enforced PAFR expression in the cells. Data presented as mean ± SEM (n = 3); ∗p < 0.01 by one-way ANOVA. (I) SP-stimulated cell migration was elevated by enforced PAFR expression in H226 cells after 48 h treatment. Data presented as mean ± SEM (n = 3); ∗p < 0.01 by one-way ANOVA. The red column was wild-type H226 cancer cells that had a low expression level of PAFR. The blue column was H226 cancer cells with forced PAFR expression.
Figure 3
Figure 3
SP promotes lung tumorigenesis by stimulating PI3K/AKT and NF-kB signaling pathways (A) PAFR-expressing H460 and H1299 cells treated with SP were analyzed by Western blot to determine expression of PI3K, AKT, and NF-kB. The cancer cells incubated with SP had higher expression levels of PI3K, AKT, and NF-kB compared with cells treated with PBS after 48 h treatment. Band intensity was determined by using ImageJ, and the ratio of each band was normalized to the corresponding GAPDH and shown below each band. SP activated PI3K, AKT, and NF-kB in H460 and H1299 cells. (B) siRNA was used to deplete PAFR in H460 and H1299. The cells were treated with SP. SP-induced activations of PI3K, AKT, and NF-kB were inhibited by the depletion of PAFR in the cells. Data presented as mean ± SEM (n = 3); ∗p < 0.01 by one-way ANOVA. (C) siRNA was used to deplete PI3K, AKT, and NF-kB in H460 and H1299, respectively. The deletion of PI3K, AKT, or NF-kB decreased the SP-stimulated cell proliferation in the cancer cells. Data presented as mean ± SEM (n = 3); ∗p < 0.01 by one-way ANOVA. (D) PCR array was used to analyze the inflammatory cytokine gene expression. SP activated pro-inflammatory cytokines (IL-1β, IL-4, IL-6, IL-8, IL-11, IL-12, TNF-α, and MCP-1) (Red). Expression levels of the cytokines in the cells treated with PBS were designated as “1” (Blue). The results are presented as the mean ± SD of three different experiments with triplicates. Data presented as mean ± SEM (n = 3); ∗p < 0.01 by one-way ANOVA. (E) Forced expression of PAFR in H226 cells was done by using PAFR-overexpressing plasmid. Enforced PAFR expression in the cancer cells increased SP-stimulated activations of PI3K, AKT, and NF-kB determined by Western Blots. (F) Enforced PAFR expression in H226 cells activated cytokines in H226 cancer cells (Red). Expression levels of the cytokines in the H226 with forced PAFR expression treated with PBS (Blue) were designated as “1”. Data presented as mean ± SEM (n = 3); ∗p < 0.01 by one-way ANOVA.
Figure 4
Figure 4
SP promotes tumorigenicity of NSCLC cells in vivo (A) SP-treated H460 cells were subcutaneously injected into male BALB/C nude mice to generate xenograft animal model. On 16 days postinjection, tumors (yellow cycles) were founded in five mice injected with the cancer cells treated with SP and four (green cycles) of the five mice injected with the cancer cells treated with PBS. (B) Xenograft tumors generated from mice inoculated with SP-treated H460 cells were considerably larger than those created from mice inoculated with PBS-treated H460 cells at the end of observation (days 28) Data presented as mean ± SEM (n = 4); ∗p = 0.0008 by one-way ANOVA. The tumor volumes of mice were measured using the formula v = (length [mm]) x (width [mm]) 2 × 0.5264. (C) Immunohistochemical staining patterns of PAFR, PI3K, AKT, NF-kB, and Ki-67 in the xenograft tumors generated from the cancer cells treated with PBS (top panel) and SP (bottom panel). Scale bar, 30 μm. Original magnification, X400. (D) PCR array was used to analyze the inflammatory cytokine gene expression in tissue specimens. The xenograft tumors created from the cancer cells treated with SP showed a higher level of pro-inflammatory cytokines (IL-4β, IL-6, IL-8, IL-11, IL-12, TNF-α, and TGF-β) compared with those generated from cancer cells treated with PBS. Expression levels of the cytokines in the xenograft tumors created from the cancer cells treated without SP treatment were designated as “1”. Data presented as mean ± SEM (n = 3); ∗p < 0.01 by one-way ANOVA.
Figure 5
Figure 5
SP promotes the development of tobacco smoke-induced lung cancer in animals (A) Representative micro-CT image of lungs of an NK-A/J mouse treated with SP and WEB2086 at week 14. A single lung tumor was identified (green circle). (B–D) micro-CT scan slices highlighted multiple tumors (yellow circles) in a mouse treated with SP at week 14. (B–D) show of micro-CT images of lungs from the same mouse. (E) 3D reconstruction of the lung tumor shown in (D). (F) H & E-stained section from the mouse lungs shown in (E) displayed the histological characteristics of lung adenocarcinomas (magnification, ×200).Scale bar, 50 μm. (G) NNK-mice with SP administration had a significant increase in the number of lung tumors compared with mice without SP treatment or mice treated with SP and WEB2086. Data presented as mean ± SEM (n = 3); ∗p < 0.01 by one-way ANOVA. (H) Lung tumors of NNK-mice with SP administration were larger than those of NNK-mice without SP treatment or NNK-mice treated with SP and WEB2086. Data presented as mean ± SEM (n = 3); ∗p < 0.01 by one-way ANOVA. (I) Mice treated with SP displayed a higher level of pro-inflammatory cytokines (IL-1β, IL-4, IL-6, IL-11, IL-12, 17A, IFN-γ, and TGF-β) in their serum compared with mice without SP treatment or treated with both SP and WEB2086. Expression levels of the cytokines in serum of the mice without SP treatment were designated as “1. FirePlex-96 Key Cytokines (Mouse) Immunoassay Panel was used to determine inflammatory cytokines in serum. The results are presented as the mean ± SD of three different experiments with triplicates. Data presented as mean ± SEM (n = 3); ∗p < 0.05 by one-way ANOVA. (J) Kaplan-Meier survival curves of A/J mice with NNK-induced lung tumors treated with or without SP or SP and WEB2086, ∗p < 0.05, log rank (Mantel-Cox) test.
Figure 6
Figure 6
SP is overrepresented in lung tumor tissues, associated with PAFR expression, and inversely correlated with disease-specific survival of the patients with NSCLC (A) SP was overabundant in lung tumor tissues compared with the corresponding noncancerous lung specimens Data presented as mean ± SEM; ∗p = 0.001 by one-way ANOVA. Amount of SP was determined by ddPCR and represented by copies of DNA/μL PCR reaction per sample. (B) A higher expression level of PAFR was found in lung tumor tissues compared with the corresponding noncancerous lung specimens. Data presented as mean ± SEM; ∗p = 0.006 by one-way ANOVA. Expression level of PAFR was determined by ddPCR and represented by copies of RNA/μL PCR reaction per sample. (C) The amount of SP was positively associated with PAFR expression in cancer tissues (n = 138, p = 0.001 by 2-tailed nonparametric Spearman correlation). (D) Kaplan-Meier survival curve for 86 clinical specimens showed overabundance of SP was associated with poor disease-specific survival in lung cancer patients (log rank (Mantel-Cox) test). p = 0.032.

Similar articles

Cited by

References

    1. National Lung Screening Trial Research Team. Aberle D.R., Adams A.M., Berg C.D., Black W.C., Clapp J.D., Fagerstrom R.M., Gareen I.F., Gatsonis C., Marcus P.M., Sicks J.D. Reduced lung-cancer mortality with low-dose computed tomographic screening. N. Engl. J. Med. 2011;365:395–409. - PMC - PubMed
    1. Garrett W.S. Cancer and the microbiota. Science. 2015;348:80–86. - PMC - PubMed
    1. Mao Q., Jiang F., Yin R., Wang J., Xia W., Dong G., Ma W., Yang Y., Xu L., Hu J. Interplay between the lung microbiome and lung cancer. Cancer Lett. 2018;415:40–48. - PubMed
    1. Wang K., Huang Y., Zhang Z., Liao J., Ding Y., Fang X., Liu L., Luo J., Kong J. A preliminary study of microbiota diversity in saliva and bronchoalveolar lavage fluid from patients with primary bronchogenic carcinoma. Med. Sci. Monit. 2019;25:2819–2834. - PMC - PubMed
    1. Hogan D.A., Willger S.D., Dolben E.L., Hampton T.H., Stanton B.A., Morrison H.G., Sogin M.L., Czum J., Ashare A. Analysis of lung microbiota in bronchoalveolar lavage, protected brush and sputum samples from subjects with mild-to-moderate cystic fibrosis lung disease. PLoS One. 2016;11:e0149998. - PMC - PubMed

LinkOut - more resources