. 2022 Dec 23;26(2):105867.
doi: 10.1016/j.isci.2022.105867. eCollection 2023 Feb 17.

Recurrent visceral leishmaniasis relapses in HIV co-infected patients are characterized by less efficient immune responses and higher parasite load

Affiliations

Recurrent visceral leishmaniasis relapses in HIV co-infected patients are characterized by less efficient immune responses and higher parasite load

Yegnasew Takele et al. iScience. .

Abstract

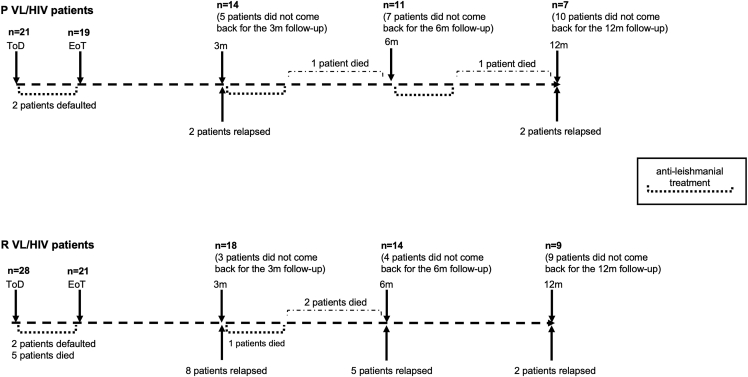
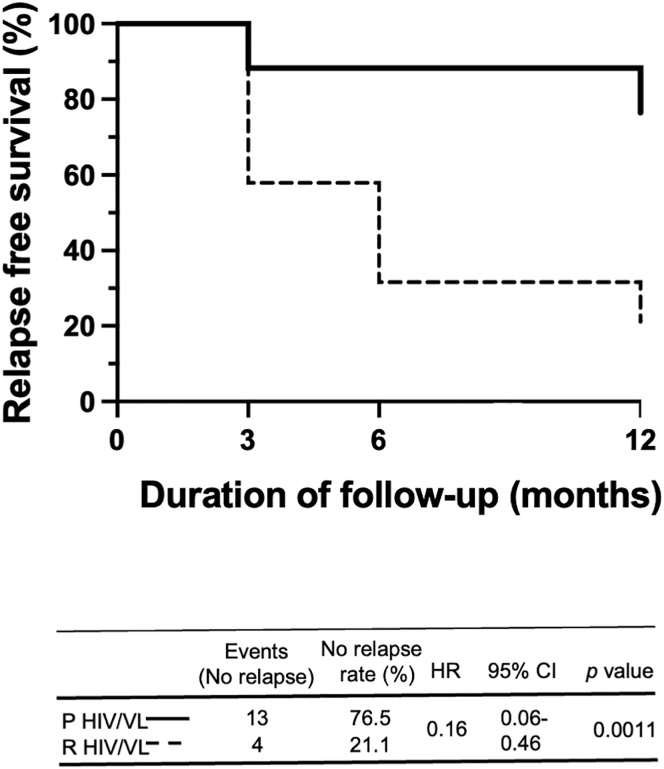
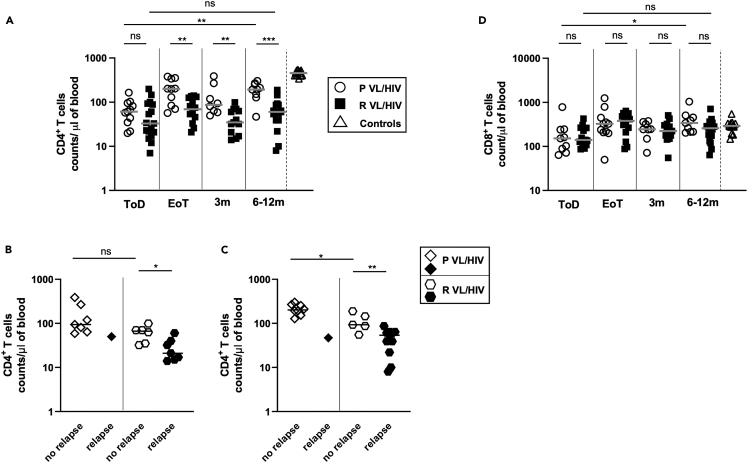
Visceral leishmaniasis (VL) and HIV co-infection (VL/HIV) has emerged as a significant public health problem in Ethiopia, with up to 30% of patients with VL co-infected with HIV. These patients suffer from recurrent VL relapses and increased mortality. Those with a previous history of VL relapses (recurrent VL/HIV) experience increased VL relapses as compared to patients with HIV presenting with their first episode of VL (primary VL/HIV). Our aim was to identify drivers that account for the higher rate of VL relapses in patients with recurrent VL/HIV (n = 28) as compared to primary VL/HIV (n = 21). Our results show that the relapse-free survival in patients with recurrent VL/HIV was shorter, that they had higher parasite load, lower weight gain, and lower recovery of all blood cell lineages. Their poorer prognosis was characterized by lower production of IFN-gamma, lower CD4+ T cell counts, and higher expression of programmed cell death protein 1 (PD1) on T cells.

Keywords: Immune response; Immunology; Virology.


Conflict of interest statement

The authors have declared that no conflict of interest exists.

Figures

None
Graphical abstract
Figure 1
Figure 1
Follow-up of patients with primary and recurrent VL/HIV 21 patients with P and 28 patients with R VL/HIV were followed for up to 6–12m. ToD = Time of Diagnosis; EoT = End of Treatment; 3m = 3 months post EoT; 6–12m = 6–12 months post EoT.
Figure 2
Figure 2
Relapse-free survival Kaplan-Meier curves of participant VL relapses comparing patients with P VL/HIV to R VL/HIV. The hazard ratios (with 95% confidence intervals and p values) obtained from the Cox model indicated the change in relapse-free survival following treatment for VL for these groups. HR, hazard ration; CI, confidence interval.
Figure 3
Figure 3
Parasite load (A) Quantification of Leishmania amastigotes in smears of splenic aspirates collected from patients with P VL/HIV (n = 16) and R VL/HIV (n = 26) at ToD. (B) Quantification of the total expression of L. donovani (LD) mRNA in blood from patients with P (ToD: n = 12, EoT: n = 16, 3m: n = 8, 6-12m: n = 7) and R VL/HIV (ToD: n = 23, EoT: n = 14, 3m: n = 16, 6-12m: n = 18). (C) Comparison of the total expression of LD mRNA in blood from patients with P VL/HIV who did not relapse (n = 7) and those who did relapse (n = 1) and R VL/HIV who did not relapse (n = 6) and those who did relapse (n = 10) 3m after successful anti-leishmanial treatment. (D) Comparison of the total expression of L. donovani mRNA in blood from P VL/HIV who did not relapse (n = 5) and those who did relapse (n = 2) and R VL/HIV who did not relapse (n = 6) and those who did relapse (n = 12) 6–12m after successful anti-leishmanial treatment. If a patient did not relapse during the 2 time points of follow-up and if a patient relapsed at both 3, 6–12 months, this is represented as 2 measurements. ns = not significant. Each symbol represents the value for one individual, the straight lines represent the median. Statistical differences between P and R VL/HIV patients (A) at each time point (B) were determined using a Mann-Whitney test; statistical differences between the 4 different time points (B) for each cohort of patients were determined by Kruskal-Wallis test.LD mRNA = L. donovani mRNA. ToD = Time of Diagnosis; EoT = End of Treatment; 3m = 3 months post EoT; 6-12m = 6–12 months post EoT. See also Table S1.
Figure 4
Figure 4
Clinical parameters (A) Body temperature was measured in patients with P VL/HIV (ToD: n = 21, EoT: n = 16, 3m: n = 14, 6-12m: n = 11) and R VL/HIV (ToD: n = 28, EoT: n = 22, 3m: n = 18, 6-12m: n = 13). (B) BMI was calculated for patients with P VL/HIV (ToD: n = 21, EoT: n = 17, 3m: n = 14, 6-12m: n = 12) and R VL/HIV (ToD: n = 28, EoT: n = 22, 3m: n = 18, 6-12m: n = 13). Each symbol represents the value for one individual, and the straight lines represent the median. Statistical differences between patients with P VL/HIV and R VL/HIV at each time point were determined using a Mann-Whitney test; statistical differences between the 4 different time points for each cohort of patients were determined by Kruskal-Wallis test. ToD = Time of Diagnosis; EoT = End of Treatment; 3m = 3 months post EoT; 6-12m = 6–12 months post EoT. ns = not significant.
Figure 5
Figure 5
Spleen sizes (A) Spleen size as measured in cm below the costal margin on patients with P VL/HIV (ToD: n = 21, EoT: n = 17, 3m: n = 14, 6–12m: n = 11) and R VL/HIV (ToD: n = 28, EoT: n = 22, 3m: n = 18, 6–12m: n = 13). (B) Comparison of the spleen of patients with P VL/HIV who did not relapse (n = 12) and those who did relapse (n = 2) and patients with R VL/HIV who did not relapse (n = 7) and those who did relapse (n = 11) 3m after successful anti-leishmanial treatment. (C) Comparison of the spleen of patients with P VL/HIV who did not relapse (n = 9) and those who did relapse (n = 2) and patients with R VL/HIV who did not relapse (n = 5) and those who did relapse (n = 8) 6–12m after successful anti-leishmanial treatment. If a patient did not relapse during the 2 time points of follow-up and if a patient relapsed at both 3, 6–12 months, this is represented as 2 measurements. Each symbol represents the value for one individual, the straight lines represent the median. Statistical differences between 2 groups were determined using a Mann-Whitney test; statistical differences between the 4 different time points for each cohort of patients were determined by Kruskal-Wallis test.ToD = Time of Diagnosis; EoT = End of Treatment; 3m = 3 months post EoT; 6-12m = 6–12 months post EoT. ns = not significant.
Figure 6
Figure 6
Whole blood assay: antigen-specific production of IFNγ and IL-10 Whole blood cells from patients with P VL/HIV (ToD: n = 16, EoT: n = 16, 3m: n = 9, 6-12m: n = 6) and R VL/HIV (ToD: n = 22, EoT: n = 23, 3m: n = 16, 6-12m: n = 17) were cultured in the presence of SLA and PBS. (A) IFNγ and (D). IL-10 levels in the supernatant were measured by ELISA after 24 h and the values obtained with PBS alone was deducted from the value obtained with SLA. (B) Comparison of IFNγ levels in the supernatant of whole blood cells from patients with P VL/HIV who did not relapse (n = 8) and those who did relapse (n = 1) and patients with R VL/HIV who did not relapse (n = 7) and those who did relapse (n = 9) 3m after successful anti-leishmanial treatment. (C) Comparison of IFNγ levels in the supernatant of whole blood cells from patients with P VL/HIV who did not relapse (n = 5) and those who did relapse (n = 1) and patients with R VL/HIV who did not relapse (n = 5) and those who did relapse (n = 12) 6-12m after successful anti-leishmanial treatment. If a patient did not relapse during the 2 time points of follow-up and if a patient relapsed at both 3, 6–12 months, this is represented as 2 measurements. Statistical differences between two groups were determined using a Mann-Whitney test; statistical differences between the 4 different time points for each cohort of patients were determined by Kruskal-Wallis test.ToD = Time of Diagnosis; EoT = End of Treatment; 3m = 3 months post EoT; 6-12m = 6–12 months post EoT. ns = not significant. See also Table S5.
Figure 7
Figure 7
CD4+ and CD8+ T cell counts (A) CD4+ T cell counts in the blood of patients with P VL/HIV (ToD: n = 11, EoT: n = 10; 3m: n = 8, 6-12m: n = 9) and R VL/HIV (ToD: n = 17, EoT: n = 14, 3m: n = 13, 6-12m: n = 16). (B) Comparison of CD4+ T cell counts in the blood of patients with P VL/HIV who did not relapse (n = 7) and those who did relapse (n = 1) and patients with R VL/HIV who did not relapse (n = 6) and those who did relapse (n = 7) 3m after successful anti-leishmanial treatment. (C) Comparison of CD4+ T cell counts in the blood of patients with P VL/HIV who did not relapse (n = 8) and those who did relapse (n = 1) and patients with R VL/HIV who did not relapse (n = 5) and those who did relapse (n = 11) during 6-12m after successful anti-leishmanial treatment. (D) CD8+ T cell counts in the blood of patients with P VL/HIV (ToD: n = 13, EoT: n = 12, 3m: n = 8, 6-12m: n = 6) and R VL/HIV (ToD: n = 11, EoT: n = 12, 3m: n = 13, 6-12m: n = 10) were measured by flow cytometry. If a patient did not relapse during the 2 time points of follow-up and if a patient relapsed at both 3, 6–12 months, this is represented as 2 measurements. Statistical differences between two groups were determined using a Mann-Whitney test; statistical differences between the 4 different time points for each cohort of patients were determined by Kruskal-Wallis test.ToD = Time of Diagnosis; EoT = End of Treatment; 3m = 3 months post EoT; 6-12m = 6–12 months post EoT. ns = not significant.
Figure 8
Figure 8
PD1 expression on CD4+ and CD8+ T cells (A) CD4 PD1 iMFI and (D). CD8 PD1 iMFI was measured by multiplying the % of T cells and the median fluorescence intensity of PD1 as measured by flow cytometry in the PBMCs of P VL/HIV (ToD: n = 13, EoT: n = 15, 3m: n = 10, 6-12m: n = 11), R VL/HIV patients (ToD: n = 15, EoT: n = 17, 3m: n = 16, 6-12m: n = 21) and healthy controls (n = 10). (B) Comparison of CD4 PD1 iMFI in patients with P VL/HIV who did not relapse (n = 9) and those who did relapse (n = 1) and patients with R VL/HIV who did not relapse (n = 9) and those who did relapse (n = 7) 3m after successful anti-leishmanial treatment. (C) Comparison of CD4 PD1 iMFI in patients with P VL/HIV who did not relapse (n = 8) and those who did relapse (n = 3) and patients with R VL/HIV who did not relapse (n = 7) and those who did relapse (n = 14) 6-12m after successful anti-leishmanial treatment. If a patient did not relapse during the 2 time points of follow-up and if a patient relapsed at both 3, 6–12 months, this is represented as 2 measurements. Statistical differences between two groups were determined using a Mann-Whitney test; statistical differences between the 4 different time points for each cohort of patients were determined by Kruskal-Wallis test.ToD = Time of Diagnosis; EoT = End of Treatment; 3m = 3 months post EoT; 6-12m = 6–12 months post EoT. ns = not significant.

Similar articles

Cited by

References

    1. Ruiz-Postigo J.A., Grout L., Jain S. Global leishmaniasis surveillance, 2017–2018, and first report on 5 additional indicators. Wkly. Epidemiol. Rec. 2020;25:165–280.
    1. WHO Technical Report Series Control of the Leishmaniasis. 2010. http://whqlibdoc.who.int/trs/WHO_TRS_949_eng.pdf - PubMed
    1. Gadisa E., Tsegaw T., Abera A., Elnaiem D.E., den Boer M., Aseffa A., Jorge A. Eco-epidemiology of visceral leishmaniasis in Ethiopia. Parasites Vectors. 2015;8:381. doi: 10.1186/s13071-015-0987-y. - DOI - PMC - PubMed
    1. Davidson R.N. Visceral leishmaniasis in clinical practice. J. Infect. 1999;39:112–116. doi: 10.1016/s0163-4453(99)90001-4. - DOI - PubMed
    1. Diro E., Edwards T., Ritmeijer K., Fikre H., Abongomera C., Kibret A., Bardonneau C., Soipei P., Mutinda B., Omollo R., et al. Long term outcomes and prognostics of visceral leishmaniasis in HIV infected patients with use of pentamidine as secondary prophylaxis based on CD4 level: a prospective cohort study in Ethiopia. PLoS Neglected Trop. Dis. 2019;13:e0007132. doi: 10.1371/journal.pntd.0007132. - DOI - PMC - PubMed