. 2023 Jan 5;26(2):105934.
doi: 10.1016/j.isci.2023.105934. eCollection 2023 Feb 17.

Interleukin 11 confers resistance to dextran sulfate sodium-induced colitis in mice

Affiliations

Interleukin 11 confers resistance to dextran sulfate sodium-induced colitis in mice

Takashi Nishina et al. iScience. .

Abstract

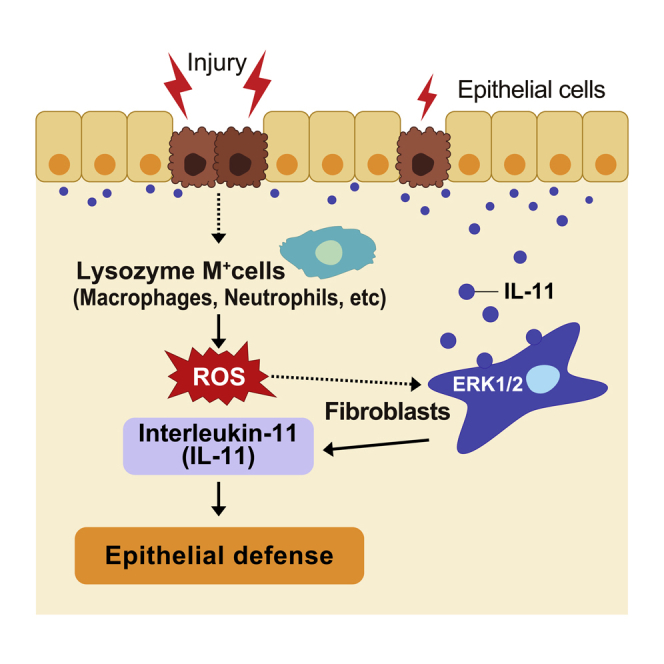
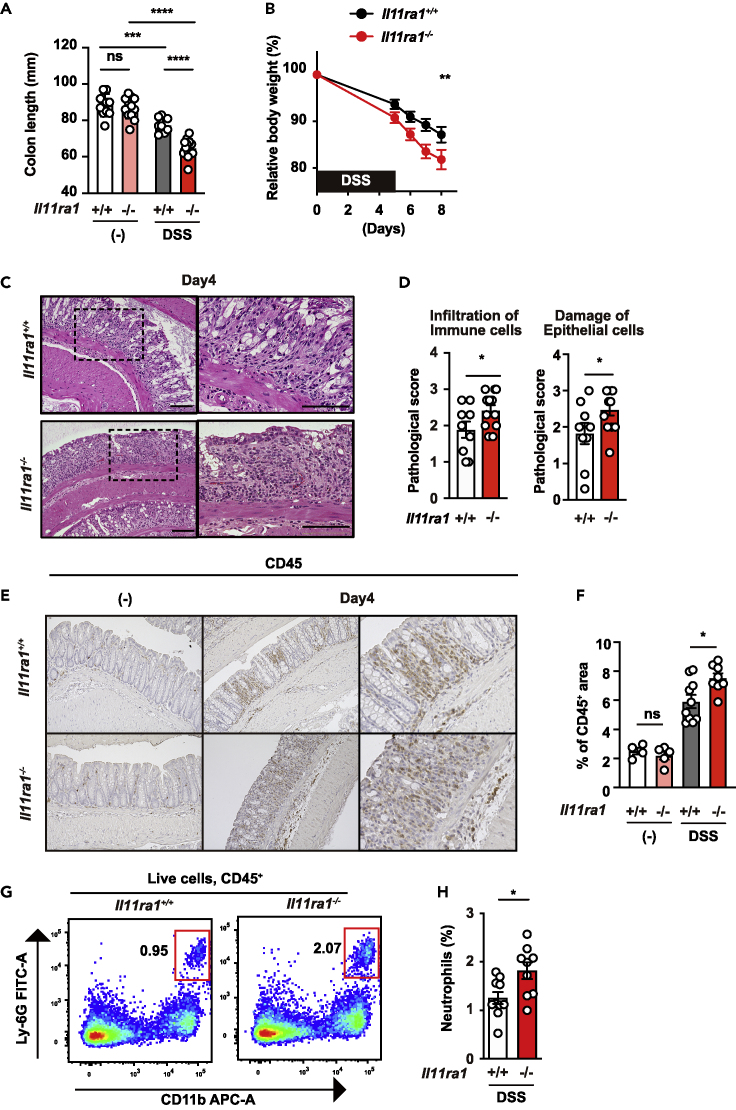
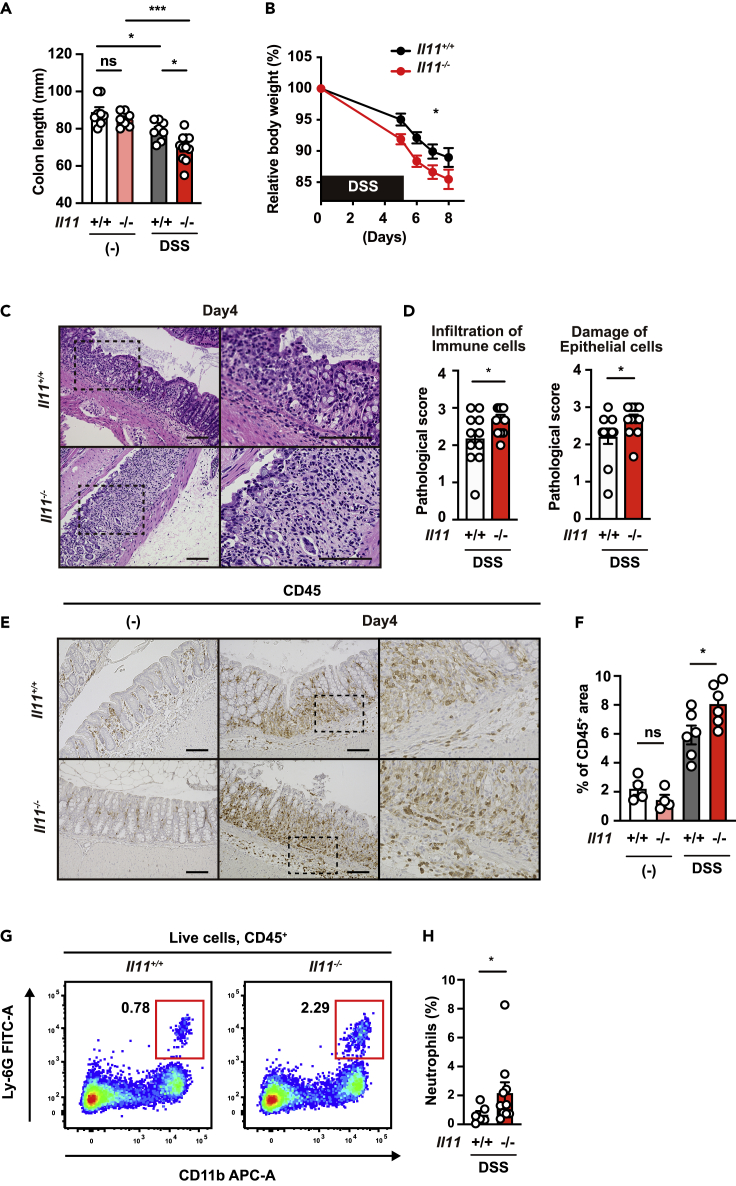
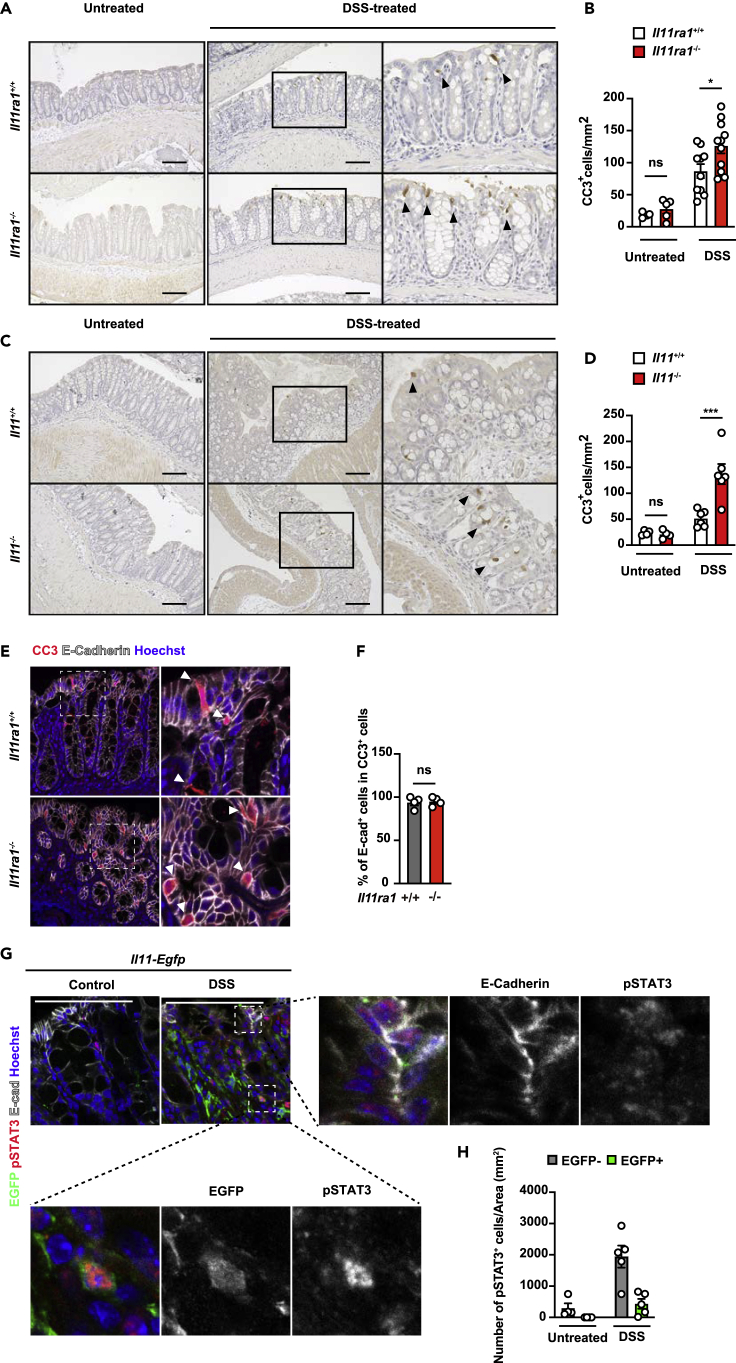
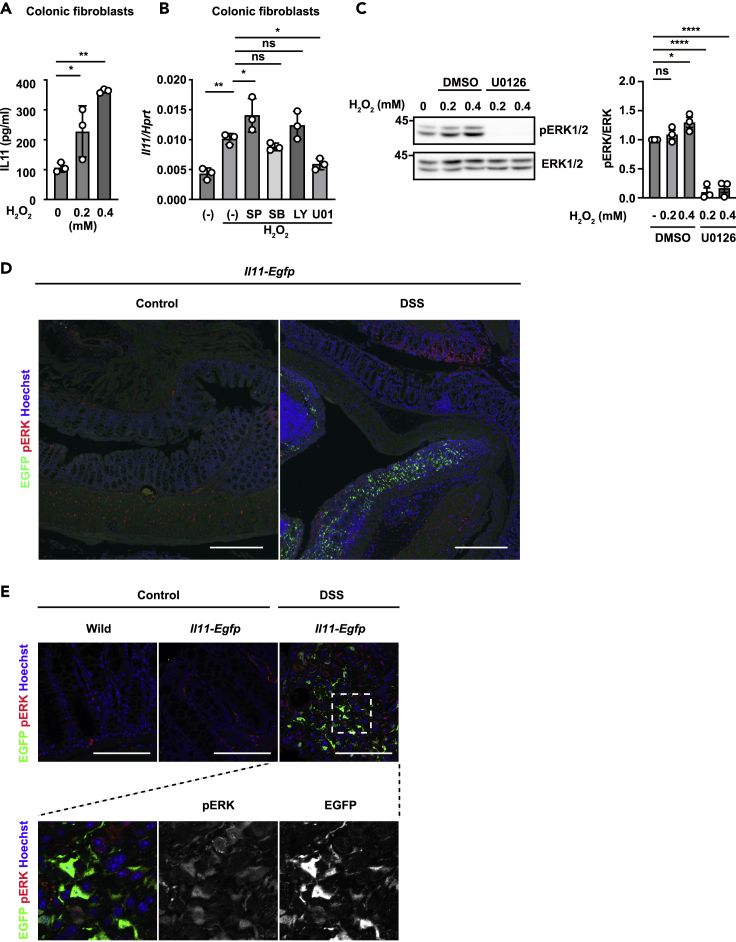
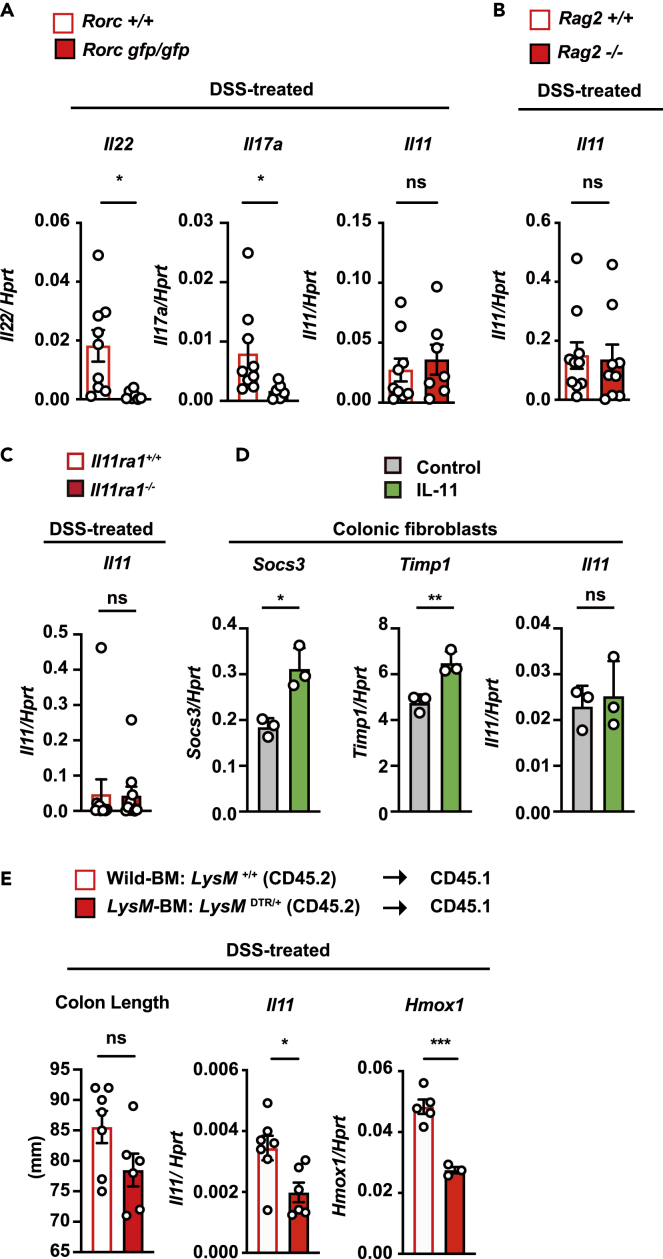
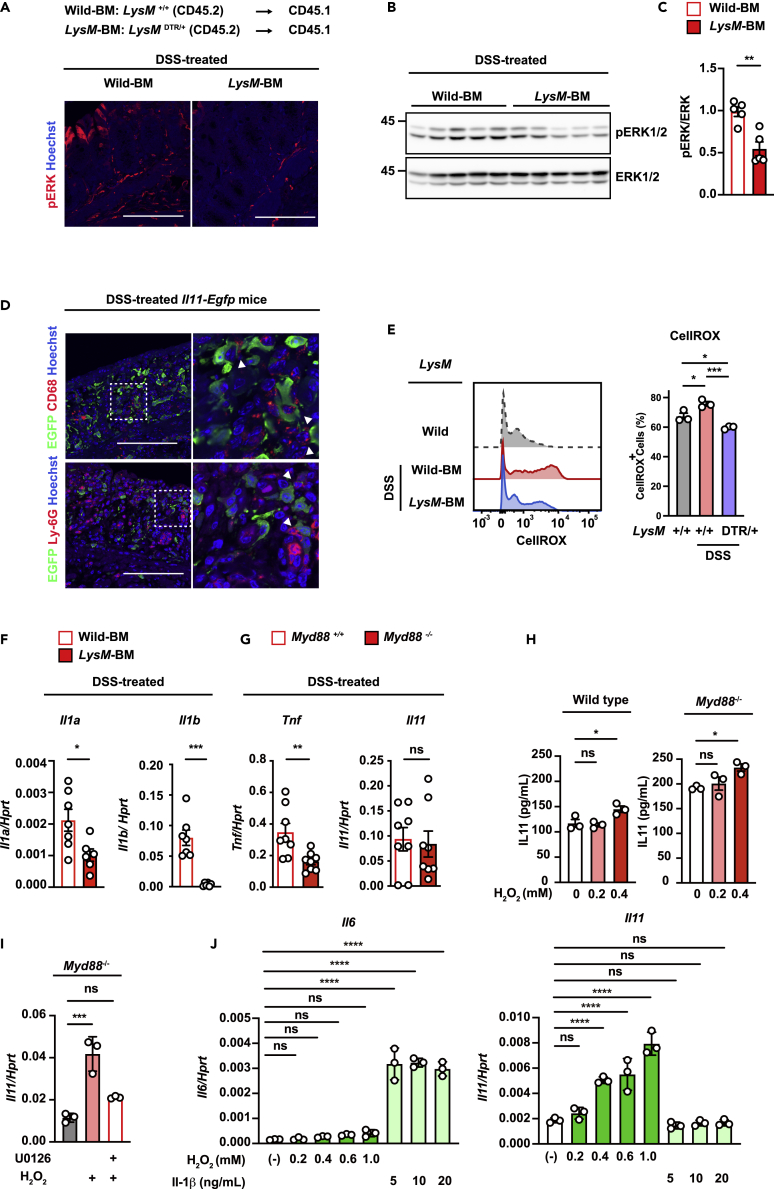
Intestinal homeostasis is tightly regulated by epithelial cells, leukocytes, and stromal cells, and its dysregulation is associated with inflammatory bowel diseases. Interleukin (IL)-11, a member of the IL-6 family of cytokines, is produced by inflammatory fibroblasts during acute colitis. However, the role of IL-11 in the development of colitis is still unclear. Herein, we showed that IL-11 ameliorated DSS-induced acute colitis in mouse models. We found that deletion of Il11ra1 or Il11 rendered mice highly susceptible to DSS-induced colitis compared to the respective control mice. The number of apoptotic epithelial cells was increased in DSS-treated Il11ra1- or Il11-deficient mice. Moreover, we showed that IL-11 production was regulated by reactive oxygen species (ROS) produced by lysozyme M-positive myeloid cells. These findings indicate that fibroblast-produced IL-11 plays an important role in protecting the mucosal epithelium in acute colitis. Myeloid cell-derived ROS contribute to the attenuation of colitis through the production of IL-11.

Keywords: Components of the immune system; Immunology; Molecular physiology.


Conflict of interest statement

The authors declare that no competing interests exist.

Figures

None
Graphical abstract
Figure 1
Figure 1
DSS-induced colitis is exacerbated in Il11ra1-/- mice (A) The colon length of untreated or DSS-treated mice was determined on day 15 after DSS treatment. The results are the mean ± SEM. n = 10 (untreated Il11ra1+/+), 13 (untreated Il11ra1−/−), 8 (DSS-treated Il11ra1+/+), or 13 (DSS-treated Il11ra1−/−) mice. Pooled data from four independent experiments. (B) Il11ra1+/+ or Il11ra1−/− mice were treated with 1.5% DSS in their drinking water for 5 days and then received normal drinking water again. The body weight of the mice was determined on day 5 and after that day. The results are expressed as percentages of initial body weight. The results are the mean ± SEM. n = 19 (Il11ra1+/+) or 18 (Il11ra1−/−) mice; pooled data from four independent experiments. (C and D) Hematoxylin and eosin (HE)-stained colonic sections of Il11ra1+/+ or Il11ra1−/− mice on day 4 after DSS administration. n = 9 (Il11ra1+/+) or 12 (Il11ra1−/−) mice; pooled data from two independent experiments. Right panels are enlarged images of the boxes in the left panels. Scale bar, 100 μm. (C) The severity of colitis was quantified based on the infiltration of immune cells (left panel) and damage to epithelial cells (right panel) as described in the STAR Methods. The results are the mean ± SEM. n = 9 (Il11ra1+/+) or 12 (Il11ra1−/−) mice; pooled data from four independent experiments (D). (E and F) Colon sections were stained with anti-CD45 antibodies (E). The CD45+ area and total area were calculated, and the percentages of CD45+ area per area are expressed (F). The results are the mean ± SEM. n = 4 (untreated Il11ra1+/+), 5 (untreated Il11ra1−/−), 10 (DSS-treated Il11ra1+/+), or 8 (DSS-treated Il11ra1−/−) mice. (G and H) The percentages of infiltrated neutrophils were increased in the colon of Il11ra1−/− mice compared with Il11ra1+/+ mice. Colonic lamina propria cells were prepared from untreated mice or mice treated with DSS on day 12, stained with the indicated antibodies, and analyzed by flow cytometry. Representative plots (G) of two independent experiments and percentages of neutrophils in the colon of an individual mouse after DSS treatment (H) are shown. The results are the mean ± SEM (n = 9 mice). Pooled data from two independent experiments. Statistical significance was determined by a two-tailed unpaired Student’s t test (D and H), two-way ANOVA with Tukey’s multiple comparisons test (A and F) or Bonferroni’s multiple comparisons test (B). ∗p < 0.05; ∗∗p < 0.01; ∗∗∗p < 0.001; ∗∗∗∗p < 0.0001; ns, not significant. See also Figure S1.
Figure 2
Figure 2
DSS-induced colitis is exacerbated in Il11-/- mice (A) Il11+/+ or Il11−/− mice were treated as in Figure 1. The colon length of untreated or DSS-treated mice was determined on day 15 after DSS treatment. The results are the mean ± SEM. n = 8 (untreated Il11+/+), 7 (untreated Il11−/−), 8 (DSS-treated Il11+/+), or 11 (DSS-treated Il11−/−) mice. Pooled data from two independent experiments. (B) The body weight of the mice was determined on day 5 and thereafter. The results are expressed as percentages of initial body weight. The results are the mean ± SEM. n = 16 (Il11+/+) or 19 (Il11−/−) mice; pooled data from four independent experiments. (C and D) Hematoxylin and eosin (HE)-stained colonic sections of Il11+/+ or Il11−/− mice on day 4 after DSS administration. Right panels are enlarged images of the boxes in the left panels. Scale bar, 100 μm. The severity of colitis was quantified based on the infiltration of immune cells (left panel) and damage to epithelial cells (right panel) as described in STAR Methods (D). The results are the mean ± SEM. n = 11 (Il11+/+) or 13 (Il11−/−) mice; pooled data from two independent experiments. (E and F) Colon sections were stained with anti-CD45 antibodies (E). The CD45+ area and total area were calculated, and the percentages of CD45+ area per total area are expressed (F). The results are the mean ± SEM. n = 4 (untreated Il11+/+), 4 (untreated Il11−/−), 6 (DSS-treated Il11+/+), 6 (DSS-treated Il11-/) mice. (G and H) The percentages of infiltrated neutrophils were increased in the colon of Il11−/− mice compared with Il11+/+ mice. Colonic lamina propria cells were prepared and analyzed as in Figure 1F. Representative plots (G) and percentages of neutrophils (H) in the colon of an individual mouse after DSS treatment (right panels) are shown. The results are the mean ±SEM. n = 6 (Il11+/+) or 11 (Il11−/−) mice. Pooled data from two independent experiments. Statistical significance was determined by two-way ANOVA with Tukey’s multiple comparisons test (A and F), Bonferroni’s multiple comparisons test (B), a two-tailed unpaired Student’s t test (D), or two-tailed Mann–Whitney U test (H). ∗p < 0.05; ∗∗∗p < 0.001.
Figure 3
Figure 3
IL-11 enhances the survival and growth of colon epithelial cells (A and B) Il11ra1+/+ or Il11ra1−/− mice were treated with 1.5% DSS in the drinking water for 4 days. Colon sections were prepared on Day 4 and stained with anti-cleaved caspase-3 (CC3) antibody (A). The right panels show an enlargement of the left boxes. The numbers of CC3+ cells were calculated, and the ratios of CC3+ cells/total tissue areas (%) are plotted (B). The results are the mean ± SEM. n = 4 (control, Il11ra1+/+), 10 (DSS-treated, Il11ra1+/+), 5 (control, Il11ra1−/−), or 11 (DSS-treated, Il11ra1−/−) mice; pooled data from two independent experiments. (C and D) Il11+/+ or Il11−/− mice were treated with 1.5% DSS in the drinking water for 4 days. Colon sections were prepared on Day 4 and stained with anti-CC3 antibodies (C). The right panels show an enlargement of the left boxes (C). The numbers of CC3+ cells were calculated, and the ratios of CC3+ cells/total tissue areas (%) are plotted (D). Black arrowheads indicate CC3+ cells (A and C). The results are the mean ± SEM. n = 4 (control, Il11+/+), 6 (DSS-treated, Il11+/+), 4 (control, Il11−/−), or 6 (DSS-treated, Il11−/−) mice; pooled data from two independent experiments. (E and F) Colon sections were stained with anti-CC3 (red), anti-E-cadherin (gray), and Hoechst 33,258 (blue) antibodies. The numbers of CC3+and E-cadherin+ cells were counted, and the percentages of both CC3- and E-cadherin-positive CC3+ cells are expressed (F). The results are the mean ± SEM. n = 4 (DSS-treated Il11ra1+/+) or 4 (DSS-treated Il11ra1−/−) mice. (G and H) Representative immunostaining of IL-11+ cells in the colon of DSS-treated mice. Colon tissue sections were prepared from untreated or DSS-treated Il11-Egfp reporter mice on day 5 following DSS treatment. Colon tissue sections were stained with anti-GFP (green), anti-E-cadherin (gray), and anti-phospho-STAT3 (pSTAT3) (red) antibodies and Hoechst 33,258 (blue). pSTAT3+ and EGFP+ cells were counted and normalized to the total tissue area (H). Scale bars, 100 μm (A, C, E, and G). Statistical significance was determined by two-way ANOVA with Tukey’s multiple comparisons test (B and D) and a two-tailed unpaired Student’s t test (F). ∗p < 0.05; ∗∗∗p < 0.001; ns, not significant. See also Figure S2.
Figure 4
Figure 4
Reactive oxygen species enhance IL-11 production in colonic fibroblasts (A) Mouse colonic fibroblasts were established from wild-type mice as described in the STAR Methods. Mouse colonic fibroblasts were stimulated with H2O2 at the indicated concentrations for 18 h. The amount of IL-11 in culture supernatants was determined by ELISA. The results are the mean ± SD (n = 3). The results are representative of two independent experiments. (B) Mouse colonic fibroblasts were stimulated with 0.6 mM H2O2 in the presence or absence of SP600125 (SP), SB203580 (SB), LY294002 (LY), or U0126 (U01) for 4 h. Relative amounts of Il11 mRNA were determined by qPCR and are presented as the means ± SDs (n = 3). Data are presented relative to Hprt expression. The results are representative of two independent experiments. (C) Primary colon fibroblasts were treated with the indicated concentration of H2O2 in the presence or absence of U0126 (20 μM) for 30 min. Total ERK and phosphorylated ERK (pERK) were analyzed by western blotting. The results are representative of three independent experiments. ERK and pERK signaling intensities were calculated by Fiji. The averages of the relative pERK/ERK ratios at the indicated points are shown (n = 3 independent experiments). (D and E) Representative immunostaining of IL-11+ cells in the colon of DSS-treated mice. Colon tissue sections were prepared from untreated or DSS-treated wild-type or Il11-Egfp reporter mice on day 5 following DSS treatment. Colon tissue sections were stained with anti-GFP (green), anti-phospho-ERK1/2 (pERK) antibodies (red), and Hoechst 33,258 (blue). Scale bars, 300 μm (D), or 100 μm (E). Statistical significance was determined by one-way ANOVA with Tukey’s post hoc test (A, B, and C). ∗p < 0.05; ∗∗p < 0.01; ∗∗∗p < 0.0001; ns, not significant.
Figure 5
Figure 5
T cells, B cells, and RORγt+ cells are not responsible for IL-11 production (A) Il22, Il17a, and Il11 mRNA levels in the colonic tissue from DSS-treated Rorc+/+ or Rorcgfp/gfp mice. On day 5 after DSS treatment, Il22, Il17a, and Il11 mRNA expression was determined by qPCR. The results are the mean ± SEM. n = 9 (Rorc+/+) or 7 (Rorcgfp/gfp) mice; pooled results from two independent experiments. (B) Il11 expression is not altered in the colon between DSS-treated Rag2+/+ and Rag2−/− mice. On day 5 after DSS treatment, Il11 expression was determined by qPCR. The results are the mean ± SEM. n = 10 (Rag2+/+) or 9 (Rag2−/−) mice; pooled results from two independent experiments. (C) Il11 expression is not altered in the colon between DSS-treated Il11ra1+/+ and Il11ra1−/− mice. On day 5 after DSS treatment, Il11 expression was determined by qPCR. The results are the mean ± SEM. n = 11 (Il11ra1+/+) or 10 (Il11ra1−/−) mice; pooled results from three independent experiments. (D) Mouse colonic fibroblasts were established from wild-type mice and stimulated with IL-11 (100 ng/mL) for 4 h. Il11 mRNA expression was determined by qPCR. The results are the mean ± SD (n = 3). The results are representative of two independent experiments. (E) LysM+ cells contribute to the increased expression of Il11 in DSS-treated mice. Bone marrow (BM) cells were prepared from LysMDTR/+ mice (CD45.2) or littermate wild-type mice. Then, the BM cells were transferred to CD45.1 recipient mice that had been exposed to lethal irradiation. At 8 weeks after transfer, the BM-transferred mice were treated with 1.5% DSS for 5 days and then injected with DT. The colon lengths were analyzed on day 7. Il11 and Hmox1 expression in the colonic tissue on day 7. We referred to CD45.1 wild-type recipient mice reconstituted with BM cells from wild-type and LysMDTR/+ mice as wild-type BM and LysM-BM mice, respectively. Statistical significance was determined by a two-tailed unpaired Student’s t test. ∗p < 0.05; ∗∗p < 0.01; ∗∗∗p < 0.001; ns, not significant. See also Figure S3.
Figure 6
Figure 6
Lysozyme M (LysM)-positive cells promote IL-11 expression during DSS-induced colitis (A–C) ERK activation was reduced in the colon of mice lacking LysM-positive cells. Wild-type BM and LysM-BM mice were prepared and treated as shown in Figure 5C. Colon tissue sections from untreated or DSS-treated wild-type BM or LysM-BM mice were immunostained with an anti-phospho-Erk1/2 antibody (pERK) (A). Scale bar, 100 μm. (n = 5 mice). Total ERK and pERK in the colonic tissue of wild-type BM or LysM-BM mice were analyzed by Western blotting (B). Total ERK and pERK signal intensities were calculated by Fiji, and the relative ratios of pERK/ERK are shown (C). The results are the mean ± SEM. (n = 5 mice); pooled results from two independent experiments. (D) Colon tissue sections were prepared from DSS-treated Il11-Egfp reporter mice on day 5 following DSS treatment. Colon tissue sections were stained with anti-GFP antibody (green) and anti-CD68 or Ly-6G antibody (red). The right panels show enlarged images of white dashed boxes from the left panels. White arrowheads indicate the interactions of GFP+ cells and CD68+ cells or Ly-6G+ cells. Scale bar, 100 μm. (n = 5 mice). (E) Colon cells were prepared and stained with CellROX-Green, and ROS accumulation was analyzed by flow cytometry. Left panels show representative histograms of ROS levels in colon cells. Right panels show the percentages of CellROX-Green+ cells from an individual mouse. The results are the mean ± SEM. (n = 3 mice). (F) Il1a and Il1b expression in the colonic tissue from DSS-treated wild-type BM or LysM-BM mice. Il1a and Il1b mRNA expression was determined by qPCR. The results are the mean ± SEM. n = 7 (wild-type BM) or 6 (LysM-BM) mice; pooled results from two independent experiments. (G) The expression of Tnf and Il11 in the colonic tissue from DSS-treated Myd88+/+ or Myd88−/− mice. The expression of Tnf and Il11 was determined by qPCR. The results are the mean ± SEM. (n = 8 mice). (H) Mouse colonic fibroblasts were established from wild-type mice or Myd88-/- mice as described in the STAR Methods. Mouse colonic fibroblasts were stimulated with H2O2 at the indicated concentrations for 12 h. The amount of IL-11 in culture supernatants was determined by ELISA. The results are the mean ± SD (n = 3). The results are representative of two independent experiments. (I) Mouse colonic fibroblasts established from Myd88−/− mice were stimulated with 0.6 mM H2O2 in the presence or absence of U0126 (20 μM) for 4 h. Il11 mRNA expression was determined by qPCR. The results are the mean ± SD (n = 3). The results are representative of two independent experiments. (J) Mouse colonic fibroblasts were established from wild-type mice stimulated with H2O2 or IL-1β at the indicated concentrations for 4 h. Il11 mRNA expression was determined by qPCR. The results are the mean ± SD (n = 3). The results are representative of two independent experiments. Statistical significance was determined using the two-tailed unpaired Student’s t test (C, F, and G) or one-way ANOVA with Tukey’s post hoc test (E, H, I, and J). ∗p < 0.05, ∗∗p < 0.01, ∗∗∗p < 0.001, ∗∗∗∗p < 0.0001; ns, not significant.

Similar articles

Cited by

References

    1. Peterson L.W., Artis D. Intestinal epithelial cells: regulators of barrier function and immune homeostasis. Nat. Rev. Immunol. 2014;14:141–153. doi: 10.1038/nri3608. - DOI - PubMed
    1. Leoni G., Neumann P.A., Sumagin R., Denning T.L., Nusrat A. Wound repair: role of immune-epithelial interactions. Mucosal Immunol. 2015;8:959–968. doi: 10.1038/mi.2015.63. - DOI - PMC - PubMed
    1. Kurashima Y., Kiyono H. Mucosal ecological network of epithelium and immune cells for gut homeostasis and tissue healing. Annu. Rev. Immunol. 2017;35:119–147. doi: 10.1146/annurev-immunol-051116-052424. - DOI - PubMed
    1. Powell D.W., Pinchuk I.V., Saada J.I., Chen X., Mifflin R.C. Mesenchymal cells of the intestinal lamina propria. Annu. Rev. Physiol. 2011;73:213–237. doi: 10.1146/annurev.physiol.70.113006.100646. - DOI - PMC - PubMed
    1. Nowarski R., Jackson R., Flavell R.A. The stromal intervention: regulation of immunity and inflammation at the epithelial-mesenchymal barrier. Cell. 2017;168:362–375. doi: 10.1016/j.cell.2016.11.040. - DOI - PubMed

LinkOut - more resources