. 2023 Jan 4:14:1033743.
doi: 10.3389/fnsyn.2022.1033743. eCollection 2022.

The calcineurin regulator Sarah enables distinct forms of homeostatic plasticity at the Drosophila neuromuscular junction

Affiliations

The calcineurin regulator Sarah enables distinct forms of homeostatic plasticity at the Drosophila neuromuscular junction

Noah S Armstrong et al. Front Synaptic Neurosci. .

Abstract

Introduction: The ability of synapses to maintain physiological levels of evoked neurotransmission is essential for neuronal stability. A variety of perturbations can disrupt neurotransmission, but synapses often compensate for disruptions and work to stabilize activity levels, using forms of homeostatic synaptic plasticity. Presynaptic homeostatic potentiation (PHP) is one such mechanism. PHP is expressed at the Drosophila melanogaster larval neuromuscular junction (NMJ) synapse, as well as other NMJs. In PHP, presynaptic neurotransmitter release increases to offset the effects of impairing muscle transmitter receptors. Prior Drosophila work has studied PHP using different ways to perturb muscle receptor function-either acutely (using pharmacology) or chronically (using genetics). Some of our prior data suggested that cytoplasmic calcium signaling was important for expression of PHP after genetic impairment of glutamate receptors. Here we followed up on that observation. Methods: We used a combination of transgenic Drosophila RNA interference and overexpression lines, along with NMJ electrophysiology, synapse imaging, and pharmacology to test if regulators of the calcium/calmodulin-dependent protein phosphatase calcineurin are necessary for the normal expression of PHP. Results: We found that either pre- or postsynaptic dysregulation of a Drosophila gene regulating calcineurin, sarah (sra), blocks PHP. Tissue-specific manipulations showed that either increases or decreases in sra expression are detrimental to PHP. Additionally, pharmacologically and genetically induced forms of expression of PHP are functionally separable depending entirely upon which sra genetic manipulation is used. Surprisingly, dual-tissue pre- and postsynaptic sra knockdown or overexpression can ameliorate PHP blocks revealed in single-tissue experiments. Pharmacological and genetic inhibition of calcineurin corroborated this latter finding. Discussion: Our results suggest tight calcineurin regulation is needed across multiple tissue types to stabilize peripheral synaptic outputs.

Keywords: Drosophila melanogaster; NMJ–neuromuscular junction; Sarah; calcineurin (CaN); neurotransmission; plasticity; synaptic dysfunction; synaptic homeostasis.


Conflict of interest statement

The authors declare that the research was conducted in the absence of any commercial or financial relationships that could be construed as a potential conflict of interest.

Figures

Figure 1
Figure 1
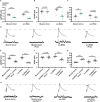
Dual pre and postsynaptic knockdown or overexpression of sra do not block PHP. (A–C) Quantification showing average mEPSP amplitude, EPSP amplitude, and NLS quantal content in pre + post-GAL4 control and pre + post-GAL4 driven sra RNAi. Black points show DMSO control synapses, green points show synapses treated with PhTx, and magenta points show animals chronically challenged with GluRIII RNAi. (D,H) Representative electrophysiological traces of EPSPs (above) and mEPSPs (below). Scale bars for all traces are y = 10 mV (1 mV), x = 20 ms (500 ms) for EPSPs (mEPSPs). (E–G) Quantification showing average mEPSP amplitude, EPSP amplitude, and NLS quantal content in pre + post-GAL4 control and pre + post-GAL4 driven sra overexpression (OE). Black points show DMSO control synapses, green points show synapses treated with PhTx, and magenta points show animals chronically challenged with GluRIII RNAi. *p < 0.05, **p < 0.01, ***p < 0.001 by Multiple Student’s T-test and corrected for multiple comparisons using the Holm-Sidak method. DMSO controls were compared to PhTx and GluRIII RNAi synapses for driver controls and separately for sra RNAi or OE. PHP, presynaptic homeostatic potentiation; mEPSPs, miniature excitatory postsynaptic potentials; EPSPs, excitatory postsynaptic potentials; NLS, non-linear summation.
Figure 2
Figure 2
Global sra mutation does not preclude PHP but does show an evoked amplitude decrease in low calcium conditions. (A–C) Quantification showing average mEPSP, EPSP amplitude, and NLS quantal content in sraMi06345, sraMi06345/Df(3R)sbd104, and GluRIIASP16; sraMi06345/Df(3R)sbd104. (D,H) Representative electrophysiological traces of EPSPs (above) and mEPSPs (below). Scale bars for all traces are y = 10 mV (1 mV), x = 20 ms (500 ms) for EPSPs (mEPSPs). (E–G) Experiments conducted in low calcium (0.2 mM). Quantification showing average mEPSP, EPSP amplitude, and NLS quantal content in sraMi06345, sraMi06345/Df(3R)sbd104, and GluRIIASP16; sraMi06345/Df(3R)sbd104. Ordinary one-way ANOVAs were used to compare each genotype followed by a Tukey’s HSD test for multiple comparisons. *p < 0.05, ***p < 0.001.
Figure 3
Figure 3
Acute expression of presynaptic homeostatic potentiation requires muscle expression of sra but maintenance does not. (A–C) Quantification showing average mEPSP amplitude, EPSP amplitude, and NLS quantal content in post-GAL4 control and post-GAL4 driven sra RNAi. Black points show DMSO control synapses, while green points show synapses treated with PhTx. (D,H) Representative electrophysiological traces of EPSPs (above) and mEPSPs (below). Scale bars for all traces are y = 10 mV (1 mV), x = 20 ms (500 ms) for EPSPs (mEPSPs). (E–G) Quantification showing average mEPSP amplitude, EPSP amplitude, and NLS quantal content in post-GAL4 control and post-GAL4 driven sra RNAi in both the presence and absence of GluRIIASP16. *p < 0.05, **p < 0.01, ***p < 0.001 by Student’s T-test vs. non-challenged genetic control.
Figure 4
Figure 4
Maintenance of presynaptic homeostatic potentiation is impaired by muscle overexpression of sra but an acute expression is not. (A–C) Quantification showing average mEPSP amplitude, EPSP amplitude, and NLS quantal content in post-GAL4 control and post-GAL4 driven sra overexpression (OE). Black points show DMSO control synapses, while green points show synapses treated with PhTx. (D,H) Representative electrophysiological traces of EPSPs (above) and mEPSPs (below). Scale bars for all traces are y = 10 mV (1 mV), x = 20 ms (500 ms) for EPSPs (mEPSPs). (E–G) Quantification showing average mEPSP amplitude, EPSP amplitude, and NLS quantal content in post-GAL4 control and post-GAL4 driven sra OE in both the presence and absence of GluRIIASP16. *p < 0.05, **p < 0.01, ***p < 0.001 by Student’s T-test vs. non-challenged genetic control.
Figure 5
Figure 5
Postsynaptic sra overexpression does not impair synapse development. (A–F) NMJs were co-stained with anti-DLG (magenta) and anti-Synapsin antibodies (green) to visualize synaptic boutons. (G) NMJ growth was assessed by bouton counting at abdominal segments A2 and A3, muscle 6/7, based on postsynaptic DLG staining and checking for presynaptic Synapsin. (H) Bouton counts were normalized per unit of muscle 6/7 area. Ordinary one-way ANOVAs were used to compare each genotype within each segment followed by a Tukey’s HSD test for multiple comparisons. *p < 0.05, **p < 0.01, ***p < 0.001. NMJ, neuromuscular junction; DLG, discs large.
Figure 6
Figure 6
Postsynaptic sra overexpression disrupts pCaMKII in Ib postsynaptic densities. (A) Maximum-intensity projections of pCaMKII (magenta) and GluRIII (green). Merged images of both channels are shown in the top row. Representative bouton maximum-intensity projections of pCaMKII (middle row) and GluRIII (bottom row) are shown as heat maps. (B) Quantification of pCaMKII intensity as a percentage relative to wild type boutons. Each point represents the intensity at an individual Ib postsynaptic density. (C) Quantification of GluRIII intensity as a percentage relative to wild type boutons. Ordinary one-way ANOVAs were used to compare each genotype followed by a Tukey’s HSD test for multiple comparisons. **p < 0.01, ***p < 0.001.
Figure 7
Figure 7
Maintenance of presynaptic homeostatic potentiation is impaired by neuronal knockdown of sra but acute expression is not. (A–C) Quantification showing average mEPSP amplitude, EPSP amplitude, and NLS quantal content in pre-GAL4 control and pre-GAL4 driven sra RNAi. Black points show DMSO control synapses, while green points show synapses treated with PhTx. (D,H) Representative electrophysiological traces of EPSPs (above) and mEPSPs (below). Scale bars for all traces are y = 10 mV (1 mV), x = 20 ms (500 ms) for EPSPs (mEPSPs). (E–G) Quantification showing average mEPSP amplitude, EPSP amplitude, and NLS quantal content in pre-GAL4 control and pre-GAL4 driven sra RNAi in both the presence and absence of GluRIIASP16. *p < 0.05, **p < 0.01, ***p < 0.001 by Student’s T-test vs. non-challenged genetic control.
Figure 8
Figure 8
Maintenance of presynaptic homeostatic potentiation is impaired by neuronal overexpression of sra but acute expression is not. (A–C) Quantification showing average mEPSP amplitude, EPSP amplitude, and NLS quantal content in pre-GAL4 control and pre-GAL4 driven sra overexpression (OE). Black points show DMSO control synapses, while green points show synapses treated with PhTx. (D,H) Representative electrophysiological traces of EPSPs (above) and mEPSPs (below). Scale bars for all traces are y = 10 mV (1 mV), x = 20 ms (500 ms) for EPSPs (mEPSPs). (E–G) Quantification showing average mEPSP amplitude, EPSP amplitude, and NLS quantal content in pre-GAL4 control and pre-GAL4 driven sra OE in both the presence and absence of GluRIIASP16. ***p < 0.001 by Student’s T-test vs. non-challenged genetic control.
Figure 9
Figure 9
Pharmacological inhibition of calcineurin partially rescues the PHP deficit observed in chronically challenged postsynaptic overexpression of sra animals. (A–C) Quantification showing average mEPSP amplitude, EPSP amplitude, and NLS quantal content in post-GAL4 control and post-GAL4 driven sra overexpression (OE) in both the presence and absence of 50 μM FK506. Black points show DMSO control synapses while dark pink points represent 50 μM FK506. (D) Representative electrophysiological traces of EPSPs (above) and mEPSPs (below). Scale bars for all traces are y = 10 mV (1 mV), x = 20 ms (500 ms) for EPSPs (mEPSPs). Two-way ANOVAs were used to compare each genotype with and without the drug followed by a Tukey’s HSD test for multiple comparisons. *p < 0.05, **p < 0.01.
Figure 10
Figure 10
Pharmacological inhibition of calcineurin rescues the PHP deficit observed in chronically challenged presynaptic knockdown of sra animals. (A–C) Quantification showing average mEPSP amplitude, EPSP amplitude, and NLS quantal content in pre-GAL4 control and pre-GAL4 driven sra knockdown in both the presence and absence of 50 μM FK506. Black points show DMSO control synapses while dark pink points represent 50 μM FK506. (D) Representative electrophysiological traces of EPSPs (above) and mEPSPs (below). Scale bars for all traces are y = 10 mV (1 mV), x = 20 ms (500 ms) for EPSPs (mEPSPs). Two-way ANOVAs were used to compare each genotype with and without the drug followed by a Tukey’s HSD test for multiple comparisons. *p < 0.05, ***p < 0.001.
Figure 11
Figure 11
Maintenance of presynaptic homeostatic potentiation can be further potentiated by pharmacologically inhibiting calcineurin. (A–D) Quantification showing average mEPSP amplitude, EPSP amplitude, NLS quantal content, and mEPSP frequency in wild type and GluRIIASP16 animals. Black points show 10 μM DMSO control, light pink points show 10 μM FK506, gray points show 50 μM DMSO control, and dark pink points show 50 μM FK506. (E,F) Quantification of failure analysis experiment. 0.10 mM Ca2+ was used in this experiment. “% failures” represents the number of stimulation pulses that failed to elicit any discernable response out of the 100 total pulses per synapse. Black points represent DMSO control, while the dark pink points represent 50 μM FK506. (G–I) Quantification showing average mEPSP amplitude, EPSP amplitude, and NLS quantal content in wild type and GluRIIASP16 animals dissected in low calcium conditions (0.20 mM Ca2+). Black points represent DMSO control, while the dark pink points represent 50 μM FK506. *p < 0.05, **p < 0.01, ***p < 0.001 by Student’s T-test vs. non-drugged control.
Figure 12
Figure 12
Dual pre- and postsynaptic knockdown of CaNB does not block PHP while knockdown in muscle alone precluded the maintenance of PHP. (A–C) Quantification showing average mEPSP amplitude, EPSP amplitude, and NLS quantal content in pre + post-GAL4 control and pre + post-GAL4 driven CaNB RNAi. Black points show DMSO control synapses, green points show synapses treated with PhTx, and magenta points show animals chronically challenged with GluRIII RNAi. (D) Representative electrophysiological traces of EPSPs (above) and mEPSPs (below). Scale bars for all traces are y = 10 mV (1 mV), x = 20 ms (500 ms) for EPSPs (mEPSPs). *p < 0.05, ***p < 0.001 by Multiple Student’s T-test and corrected for multiple comparisons using the Holm-Sidak method. DMSO controls were compared to PhTx and GluRIII RNAi synapses for driver controls and separately for CaNB RNAi.

Similar articles

Cited by

References

    1. Ahern G. P., Junankar P. R., Dulhunty A. F. (1994). Single channel activity of the ryanodine receptor calcium release channel is modulated by FK-506. FEBS Lett. 352, 369–374. 10.1016/0014-5793(94)01001-3 - DOI - PubMed
    1. André E. A., Forcelli P. A., Pak D. T. (2018). What goes up must come down: homeostatic synaptic plasticity strategies in neurological disease. Future Neurol. 13, 13–21. 10.2217/fnl-2017-0028 - DOI - PMC - PubMed
    1. Aponte-santiago N. A., Littleton J. T. (2020). Synaptic properties and plasticity mechanisms of invertebrate tonic and phasic neurons. Front. Physiol. 11:611982. 10.3389/fphys.2020.611982 - DOI - PMC - PubMed
    1. Aponte-santiago N. A., Ormerod K. G., Akbergenova Y., Littleton J. T. (2020). Synaptic plasticity induced by differential manipulation of tonic and phasic motoneurons in Drosophila. J. Neurosci. 40, 6270–6288. 10.1523/JNEUROSCI.0925-20.2020 - DOI - PMC - PubMed
    1. Baumgärtel K., Mansuy I. M. (2012). Neural functions of calcineurin in synaptic plasticity and memory. Learn. Mem. 19, 375–384. 10.1101/lm.027201.112 - DOI - PubMed

LinkOut - more resources