

Prognostic value of long non-coding RNA MALAT1 in hepatocellular carcinoma: A study based on multi-omics analysis and RT-PCR validation
- PMID: 36685103
- PMCID: PMC9845286
- DOI: 10.3389/pore.2022.1610808
Prognostic value of long non-coding RNA MALAT1 in hepatocellular carcinoma: A study based on multi-omics analysis and RT-PCR validation
Abstract
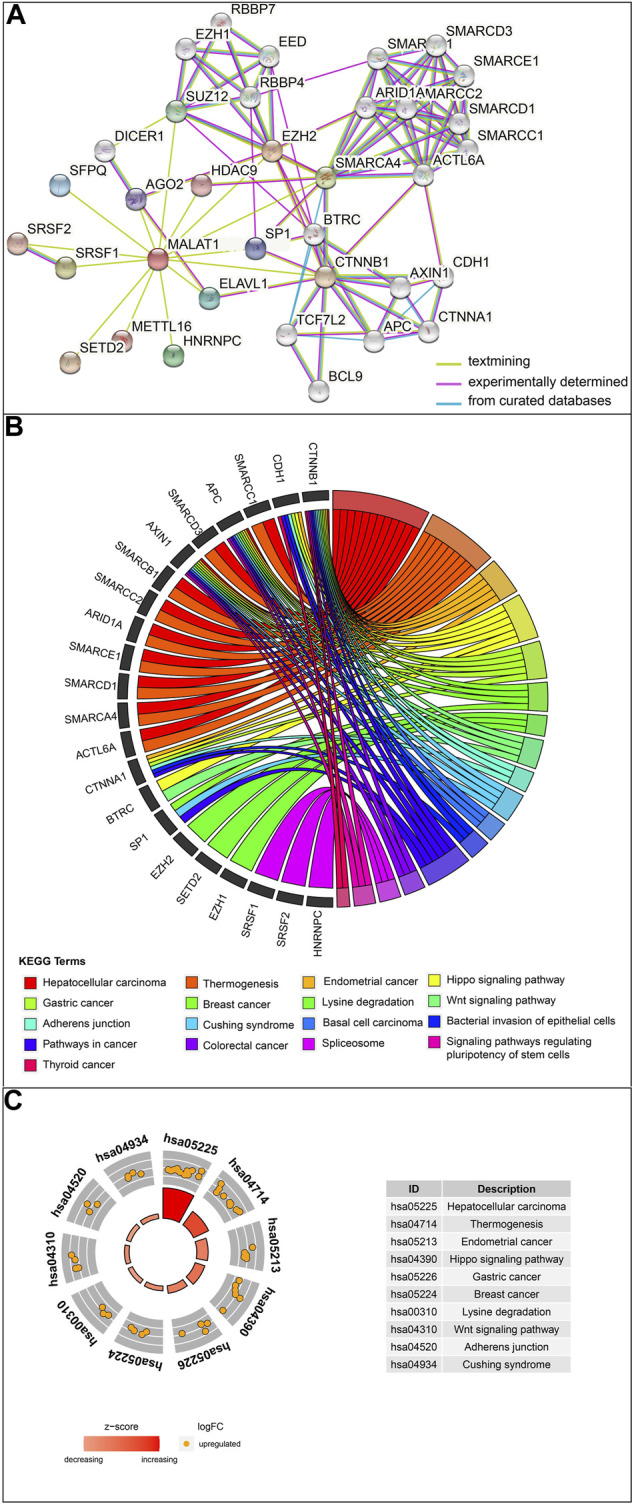
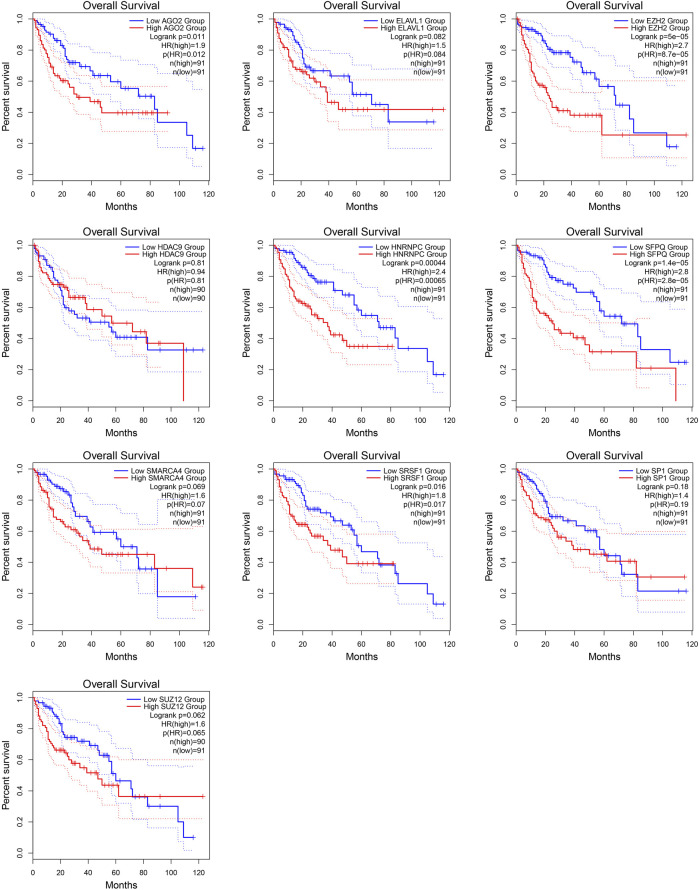
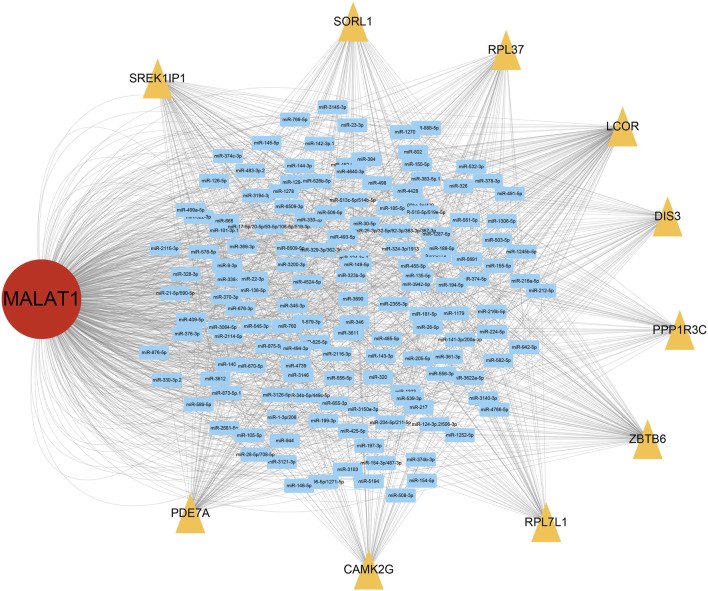
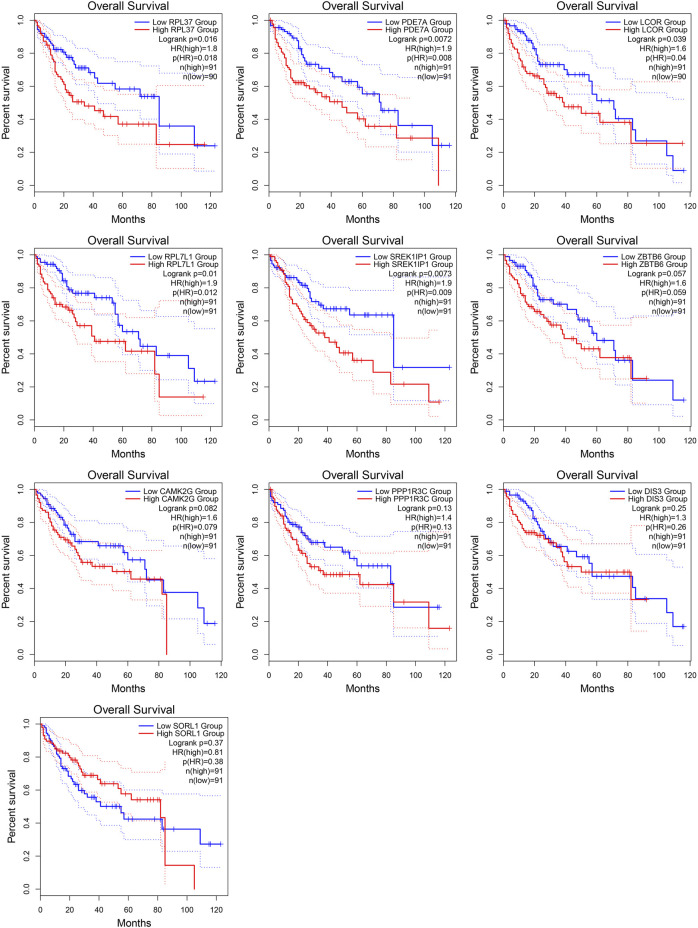
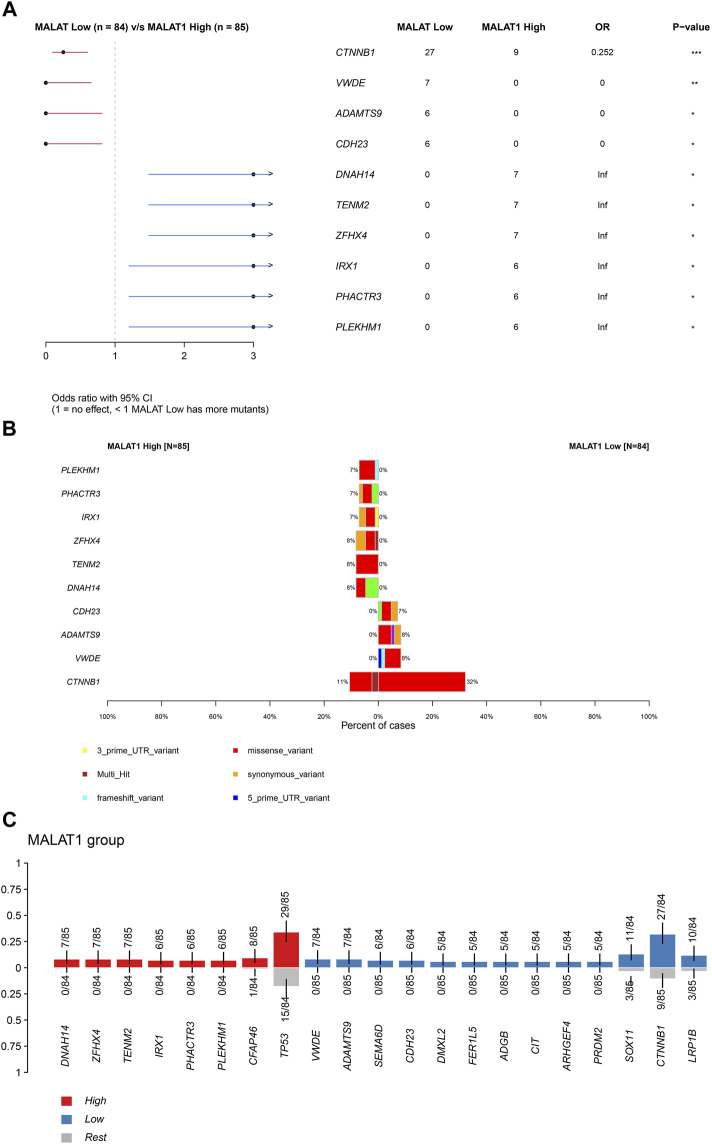
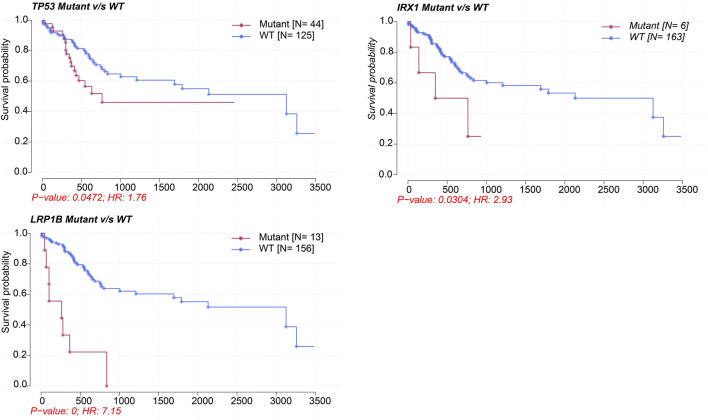
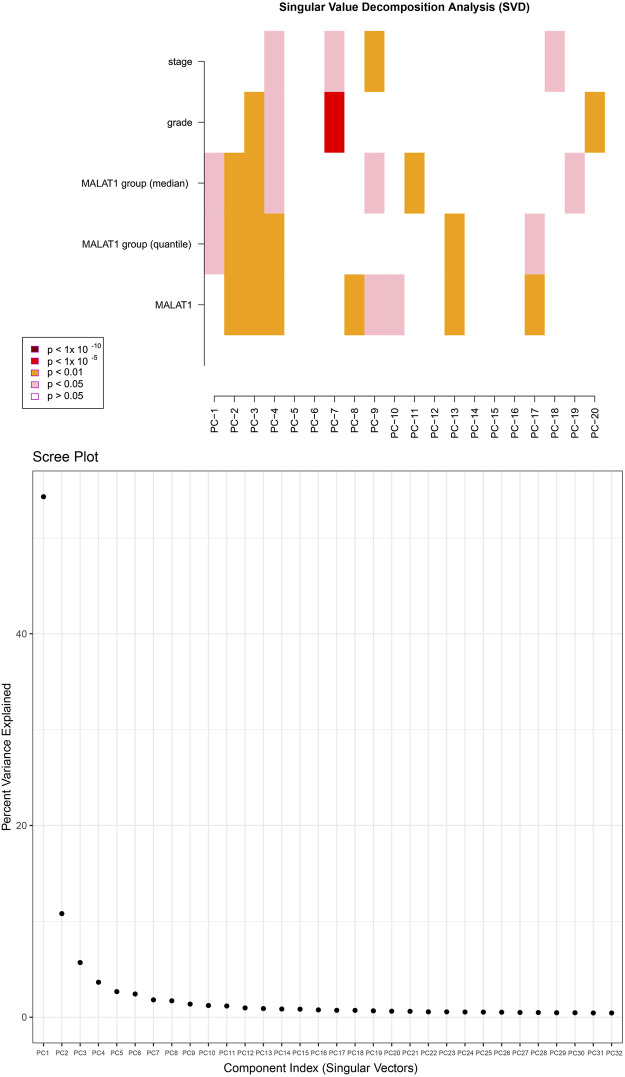
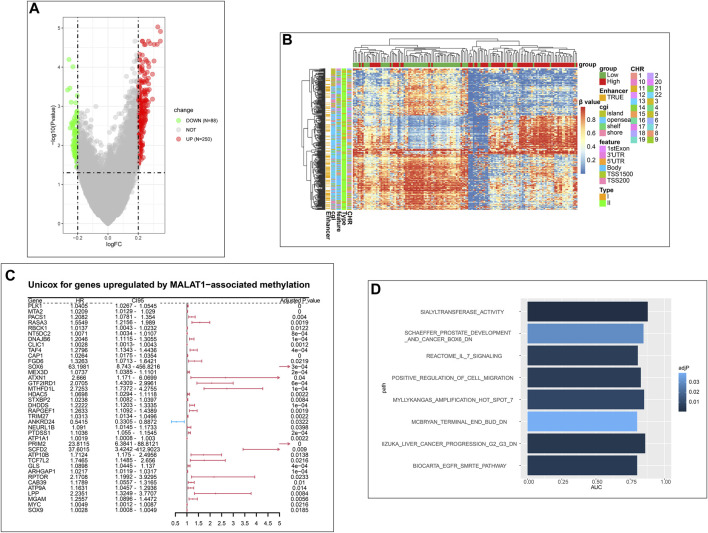
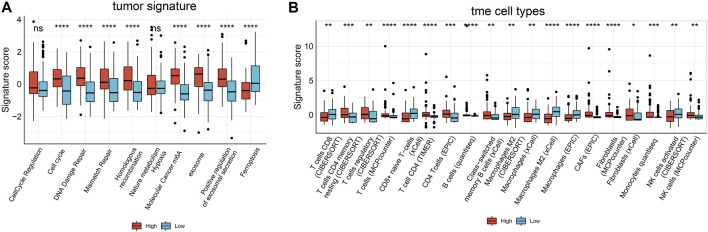
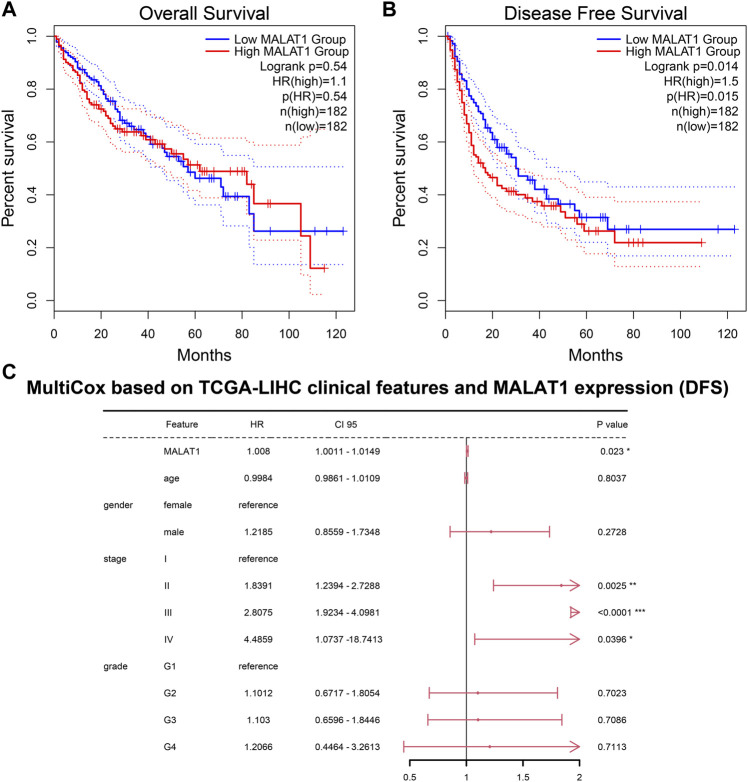
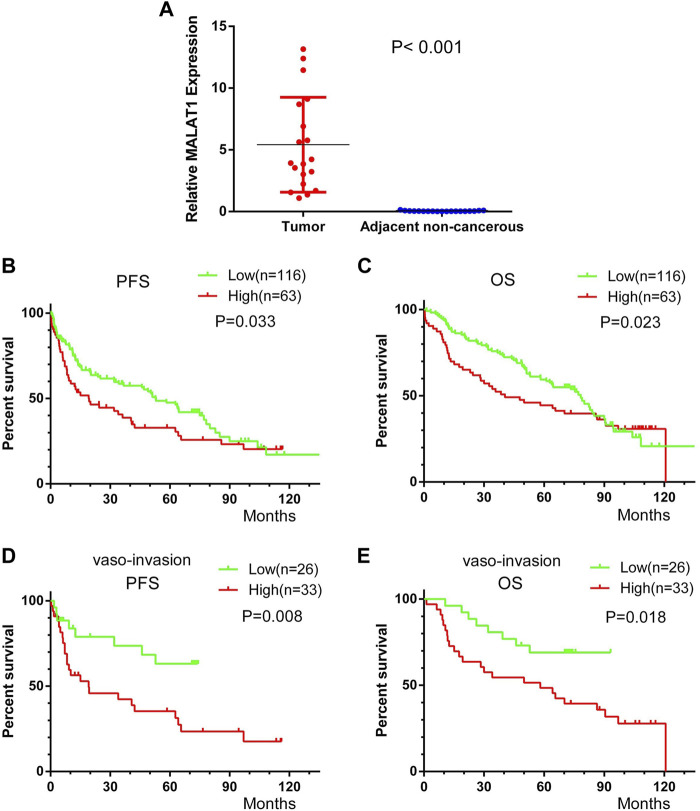
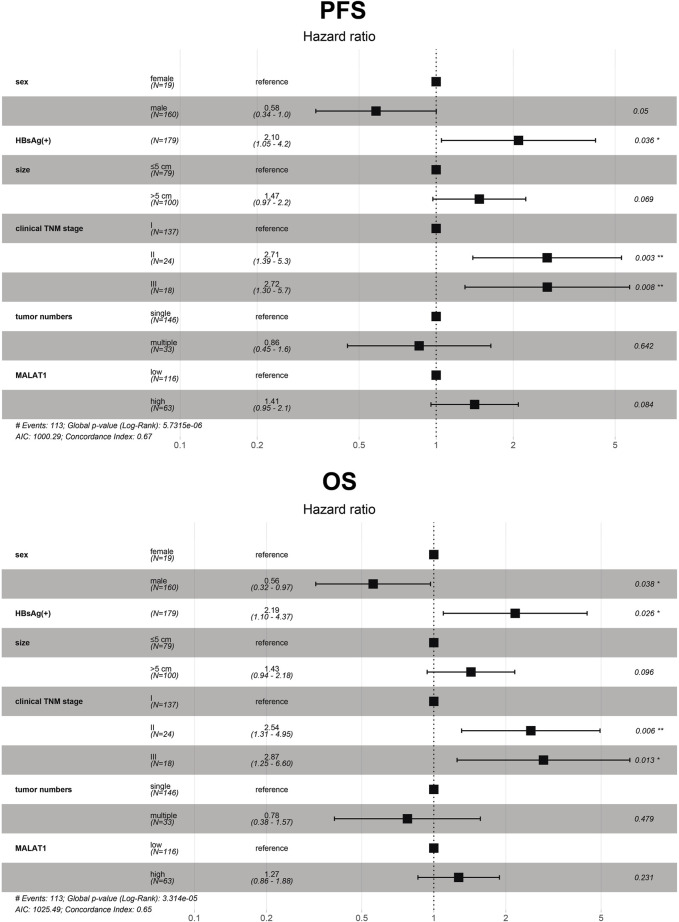
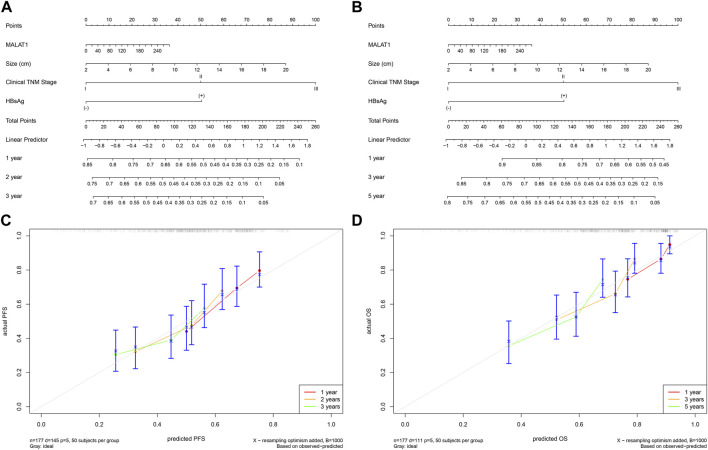
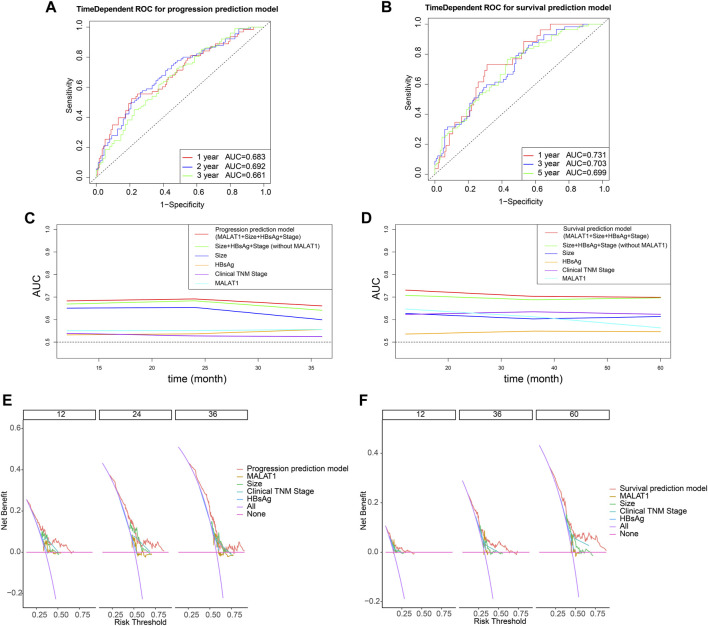
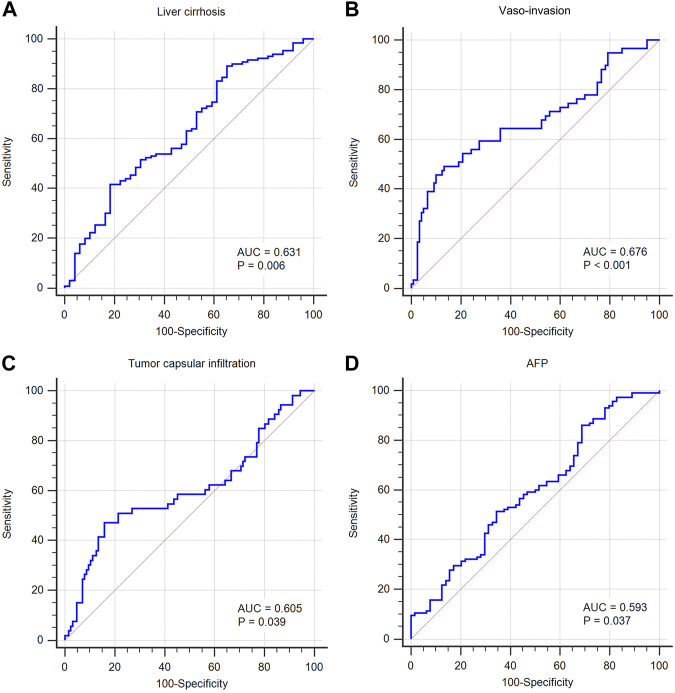
Background: This study aimed to explore the relationship between MALAT1 and the prognosis of patients with hepatocellular carcinoma (HCC). Methods: We constructed a MALAT1 protein-protein interaction network using the STRING database and a network of competing endogenous RNAs (ceRNAs) using the StarBase database. Using data from the GEPIA2 database, we studied the association between genes in these networks and survival of patients with HCC. The potential mechanisms underlying the relationship between MALAT1 and HCC prognosis were studied using combined data from RNA sequencing, DNA methylation, and somatic mutation data from The Cancer Genome Atlas (TCGA) liver cancer cohort. Tumor tissues and 19 paired adjacent non-tumor tissues (PANTs) from HCC patients who underwent radical resection were analyzed for MALAT1 mRNA levels using real-time PCR, and associations of MALAT1 expression with clinicopathological features or prognosis of patients were analyzed using log-rank test and Gehan-Breslow-Wilcoxon test. Results: Five interacting proteins and five target genes of MALAT1 in the ceRNA network significantly correlated with poor survival of patients with HCC (p < 0.05). High MALAT1 expression was associated with mutations in two genes leading to poor prognosis and may upregulate some prognostic risk genes through methylation. MALAT1 was significantly co-expressed with various signatures of genes involved in HCC progression, including the cell cycle, DNA damage repair, mismatch repair, homologous recombination, molecular cancer m6A, exosome, ferroptosis, infiltration of lymphocyte (p < 0.05). The expression of MALAT1 was markedly upregulated in HCC tissues compared with PANTs. In Kaplan-Meier analysis, patients with high MALAT1 expression had significantly shorter progression-free survival (PFS) (p = 0.033) and overall survival (OS) (p = 0.023) than those with low MALAT1 expression. Median PFS was 19.2 months for patients with high MALAT1 expression and 52.8 months for patients with low expression, while the corresponding median OS was 40.5 and 78.3 months. In subgroup analysis of patients with vascular invasion, cirrhosis, and HBsAg positive or AFP positive, MALAT1 overexpression was significantly associated with shorter PFS and OS. Models for predicting PFS and OS constructed based on MALAT1 expression and clinicopathological features had moderate predictive power, with areas under the receiver operating characteristic curves of 0.661-0.731. Additionally, MALAT1 expression level was significantly associated with liver cirrhosis, vascular invasion, and tumor capsular infiltration (p < 0.05 for all). Conclusion: MALAT1 is overexpressed in HCC, and higher expression is associated with worse prognosis. MALAT1 mRNA level may serve as a prognostic marker for patients with HCC after hepatectomy.
Keywords: DNA methylation; competing endogenous RNAs (ceRNAs); hepatocellular carcinoma; interacting proteins; metastasis associated lung adenocarcinoma transcript 1 (MALAT1); multi-omics; mutation; prognosis.
Copyright © 2023 Liao, Chen, Luo, Luo, Huang and Xie.
Conflict of interest statement
The authors declare that the research was conducted in the absence of any commercial or financial relationships that could be construed as a potential conflict of interest.
Figures
Similar articles
-
Screening prognostic markers for hepatocellular carcinoma based on pyroptosis-related lncRNA pairs.BMC Bioinformatics. 2023 Apr 29;24(1):176. doi: 10.1186/s12859-023-05299-9. BMC Bioinformatics. 2023. PMID: 37120506 Free PMC article.
-
Genome-Wide Analysis of Prognostic lncRNAs, miRNAs, and mRNAs Forming a Competing Endogenous RNA Network in Hepatocellular Carcinoma.Cell Physiol Biochem. 2018;48(5):1953-1967. doi: 10.1159/000492519. Epub 2018 Aug 9. Cell Physiol Biochem. 2018. PMID: 30092571
-
Oncogenic long noncoding RNA MALAT1 and HCV-related hepatocellular carcinoma.Biomed Pharmacother. 2018 Jun;102:653-669. doi: 10.1016/j.biopha.2018.03.105. Epub 2018 Apr 5. Biomed Pharmacother. 2018. PMID: 29604585
-
A novel prognostic biomarker SPC24 up-regulated in hepatocellular carcinoma.Oncotarget. 2015 Dec 1;6(38):41383-97. doi: 10.18632/oncotarget.5510. Oncotarget. 2015. PMID: 26515591 Free PMC article.
-
Long noncoding RNA small nucleolar RNA host genes as prognostic molecular biomarkers in hepatocellular carcinoma: A meta-analysis.Cancer Med. 2024 Apr;13(8):e7200. doi: 10.1002/cam4.7200. Cancer Med. 2024. PMID: 38634194 Free PMC article.
Cited by
-
Role of ferroptosis and its non-coding RNA regulation in hepatocellular carcinoma.Front Pharmacol. 2023 Apr 13;14:1177405. doi: 10.3389/fphar.2023.1177405. eCollection 2023. Front Pharmacol. 2023. PMID: 37124203 Free PMC article. Review.
-
Evaluation of the clinical significance of long non-coding RNA MALAT1 genetic variants in human lung adenocarcinoma.Aging (Albany NY). 2024 Mar 21;16(6):5740-5750. doi: 10.18632/aging.205675. Epub 2024 Mar 21. Aging (Albany NY). 2024. PMID: 38517388 Free PMC article.
-
Effects of DNA, RNA, and Protein Methylation on the Regulation of Ferroptosis.Int J Biol Sci. 2023 Jul 9;19(11):3558-3575. doi: 10.7150/ijbs.85454. eCollection 2023. Int J Biol Sci. 2023. PMID: 37497000 Free PMC article. Review.
-
Long Noncoding RNAs MALAT1 and HOTTIP Act as Serum Biomarkers for Hepatocellular Carcinoma.Cancer Control. 2024 Jan-Dec;31:10732748241284821. doi: 10.1177/10732748241284821. Cancer Control. 2024. PMID: 39259658 Free PMC article.
-
Exosome Cargos as Biomarkers for Diagnosis and Prognosis of Hepatocellular Carcinoma.Pharmaceutics. 2023 Sep 21;15(9):2365. doi: 10.3390/pharmaceutics15092365. Pharmaceutics. 2023. PMID: 37765333 Free PMC article. Review.
References
-
- Chen LT, Martinelli E, Cheng AL, Pentheroudakis G, Qin S, Bhattacharyya GS, et al. Pan-asian adapted ESMO clinical practice guidelines for the management of patients with intermediate and advanced/relapsed hepatocellular carcinoma: A TOS-ESMO initiative endorsed by CSCO, ISMPO, JSMO, KSMO, MOS and SSO. Ann Oncol (2020) 31(3):334–51. 10.1016/j.annonc.2019.12.001 - DOI - PubMed
MeSH terms
Substances
LinkOut - more resources
Full Text Sources
Medical