

Automated identification and assessment of environmental noise sources
- PMID: 36685460
- PMCID: PMC9852937
- DOI: 10.1016/j.heliyon.2023.e12846
Automated identification and assessment of environmental noise sources
Erratum in
-
Erratum to "Automated identification and assessment of environmental noise sources" [Heliyon Volume 9, Issue 1, JANUARY 2023, Article e12846].Heliyon. 2023 Feb 26;9(3):e13981. doi: 10.1016/j.heliyon.2023.e13981. eCollection 2023 Mar. Heliyon. 2023. PMID: 37101471 Free PMC article.
Abstract
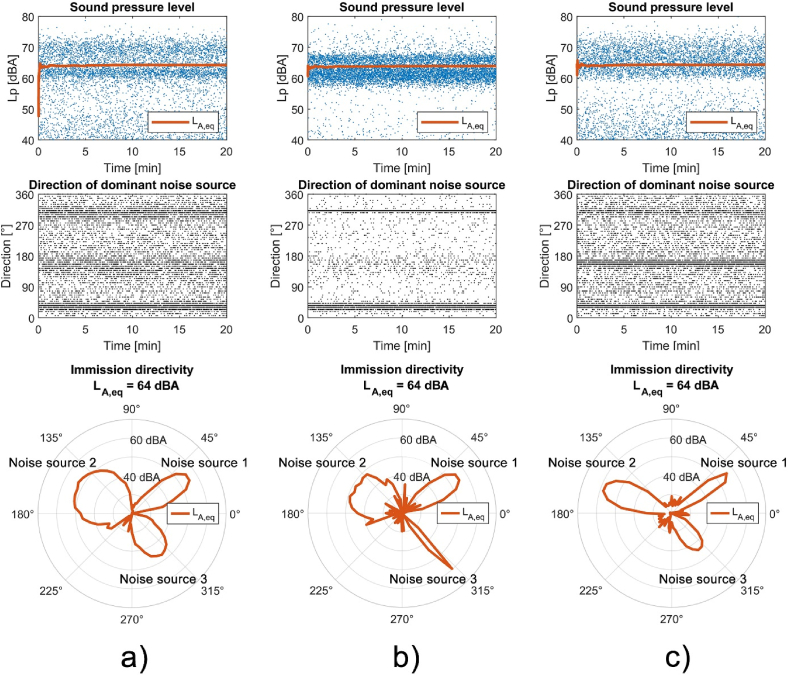
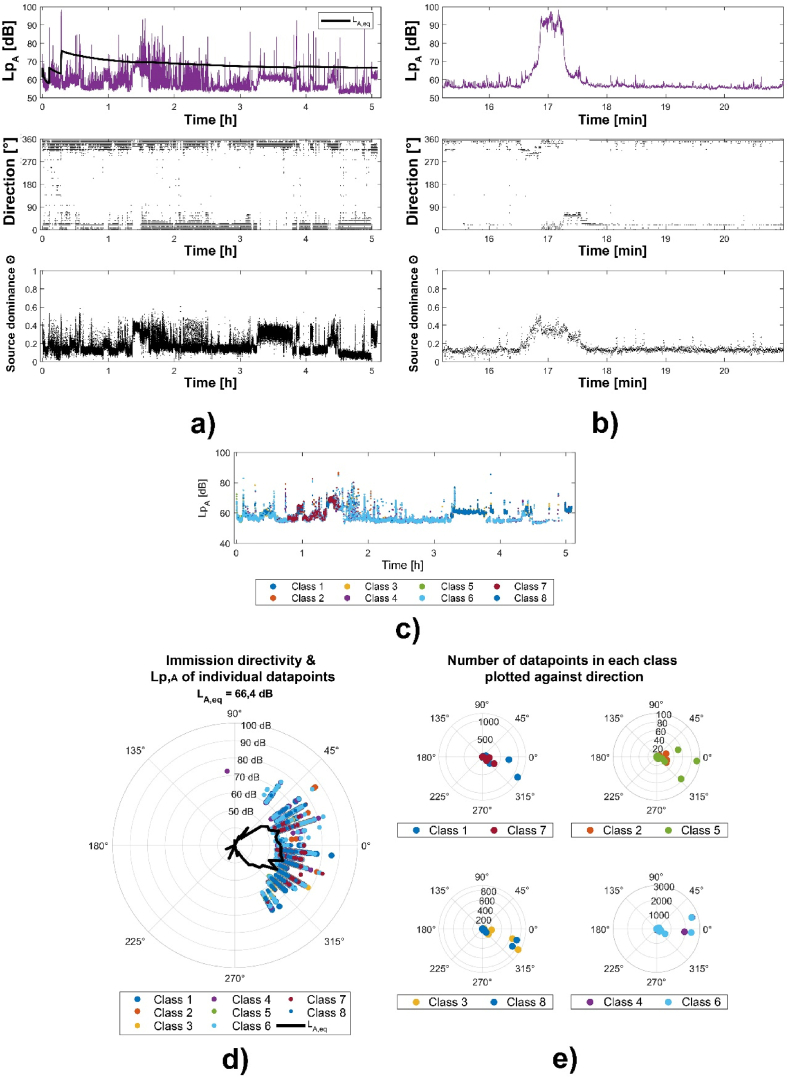
Noise pollution is one of the major health risks in urban life. The approach to measurement and identification of noise sources needs to be improved and enhanced to reduce high costs. Long measurement times and the need for expensive equipment and trained personnel must be automated. Simplifying the identification of main noise sources and excluding residual and background noise allows more effective measures. By spatially filtering the acoustic scene and combining unsupervised learning with psychoacoustic features, this paper presents a prototype system capable of automated calculation of the contribution of individual noise sources to the total noise level. Pilot measurements were performed at three different locations in the city of Ljubljana, Slovenia. Equivalent sound pressure levels obtained with the device were compared to the results obtained by manually marking individual parts of each of the three measurements. The proposed approach correctly identified the main noise sources in the vicinity of the measurement points.
Keywords: Automatization of measurements; Environmental noise; Immission directivity; Microphone array; Noise source classification; Spatial filtering.
© 2023 The Authors.
Conflict of interest statement
The authors declare that they have no known competing financial interests or personal relationships that could have appeared to influence the work reported in this paper.
Figures


References
-
- Cole-Hunter Tom, et al. Science of The Total Environment; 2022. Long-term Exposure to Road Traffic Noise and All-Cause and Cause-specific Mortality: a Danish Nurse Cohort Study. - PubMed
-
- Smith Michael G., et al. Traffic noise-induced changes in wake-propensity measured with the Odds-Ratio Product (ORP) Sci. Total Environ. 2022;805 - PubMed
-
- Sanok Sandra, et al. Road traffic noise impacts sleep continuity in suburban residents: exposure-response quantification of noise-induced awakenings from vehicle pass-by at night. Sci. Total Environ. 2022;817 - PubMed
-
- Münzel Thomas, Sørensen Mette, Daiber Andreas. Transportation noise pollution and cardiovascular disease. Nat. Rev. Cardiol. 2021:1–18. - PubMed
LinkOut - more resources
Full Text Sources
