. 2023 Jan 4:13:991604.
doi: 10.3389/fimmu.2022.991604. eCollection 2022.

Comprehensive analysis of cuproptosis-related lncRNAs for prognostic significance and immune microenvironment characterization in hepatocellular carcinoma

Affiliations

Comprehensive analysis of cuproptosis-related lncRNAs for prognostic significance and immune microenvironment characterization in hepatocellular carcinoma

Duguang Li et al. Front Immunol. .

Abstract

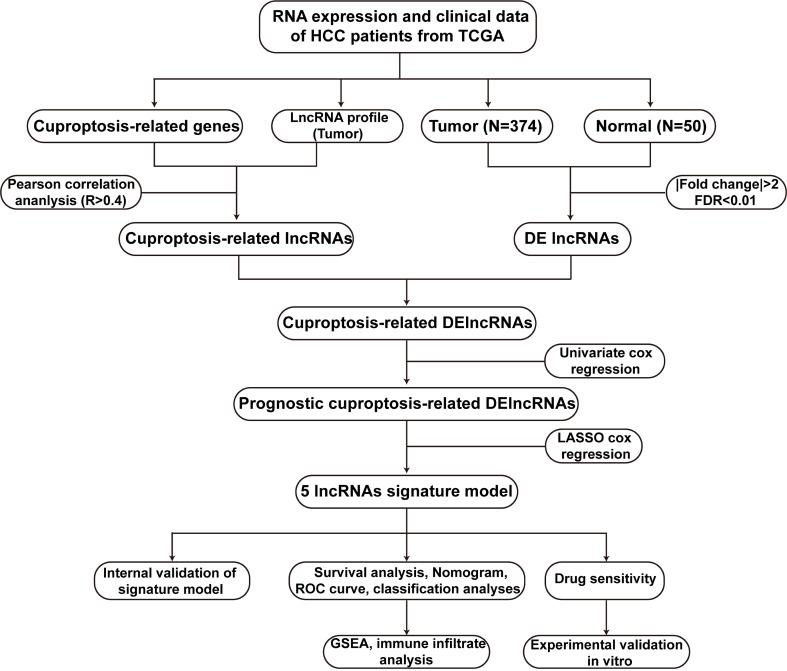
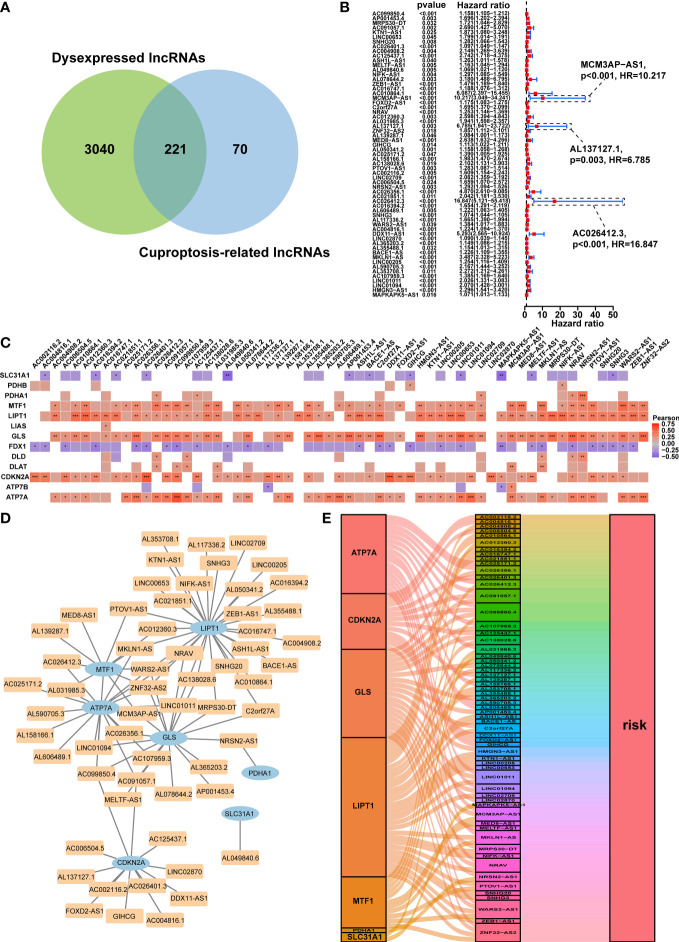
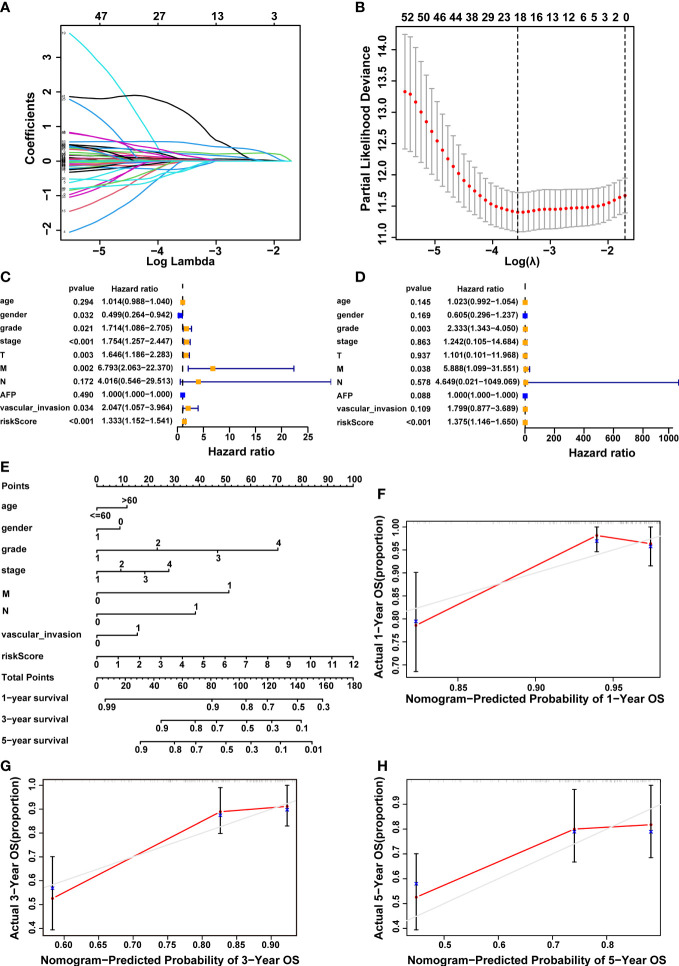
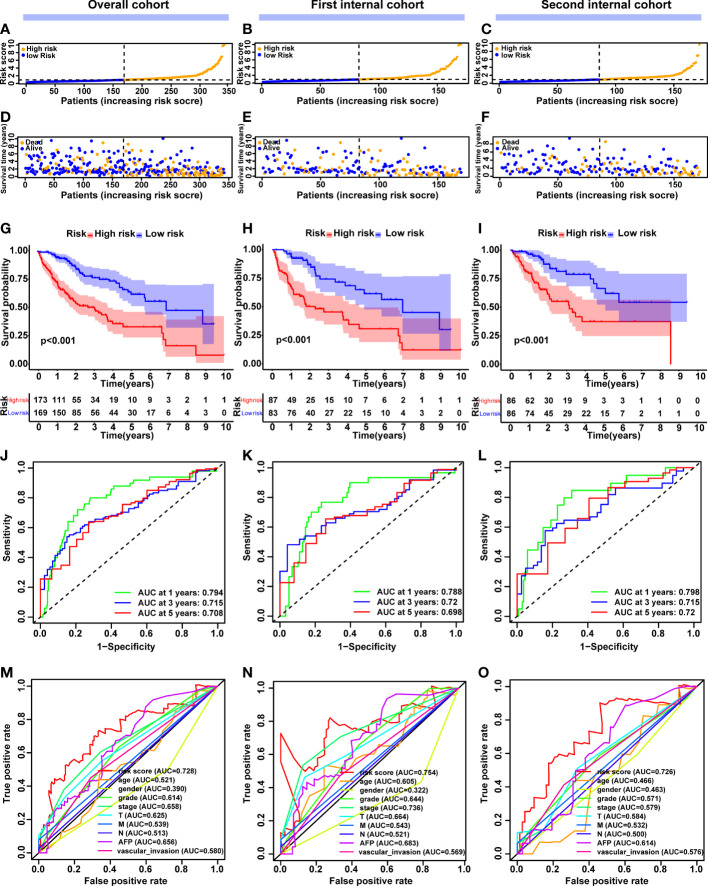
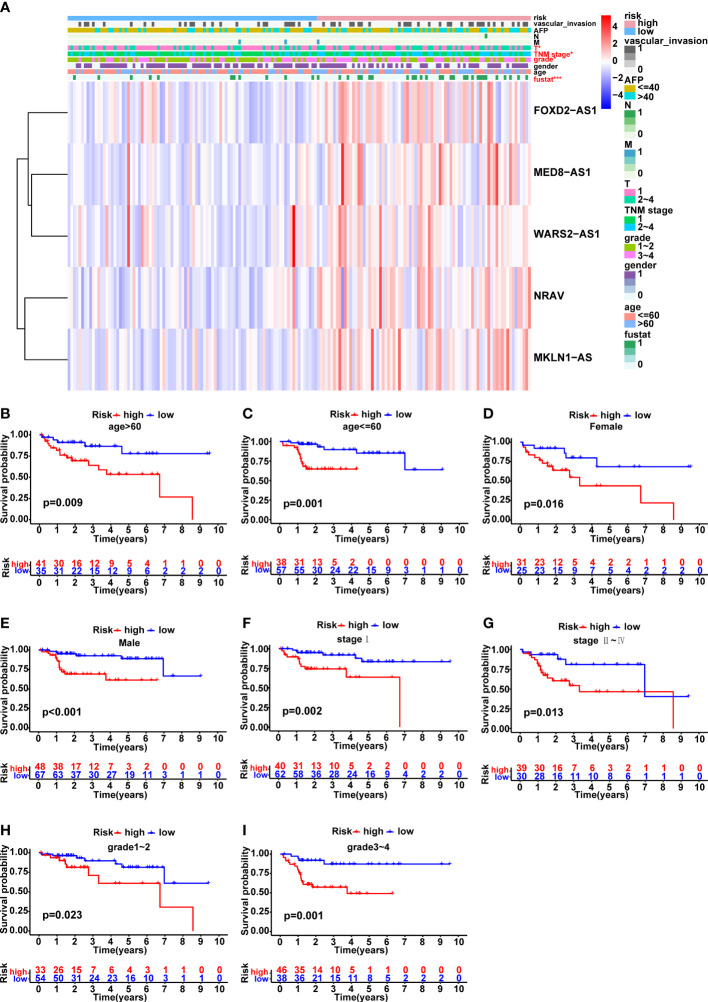
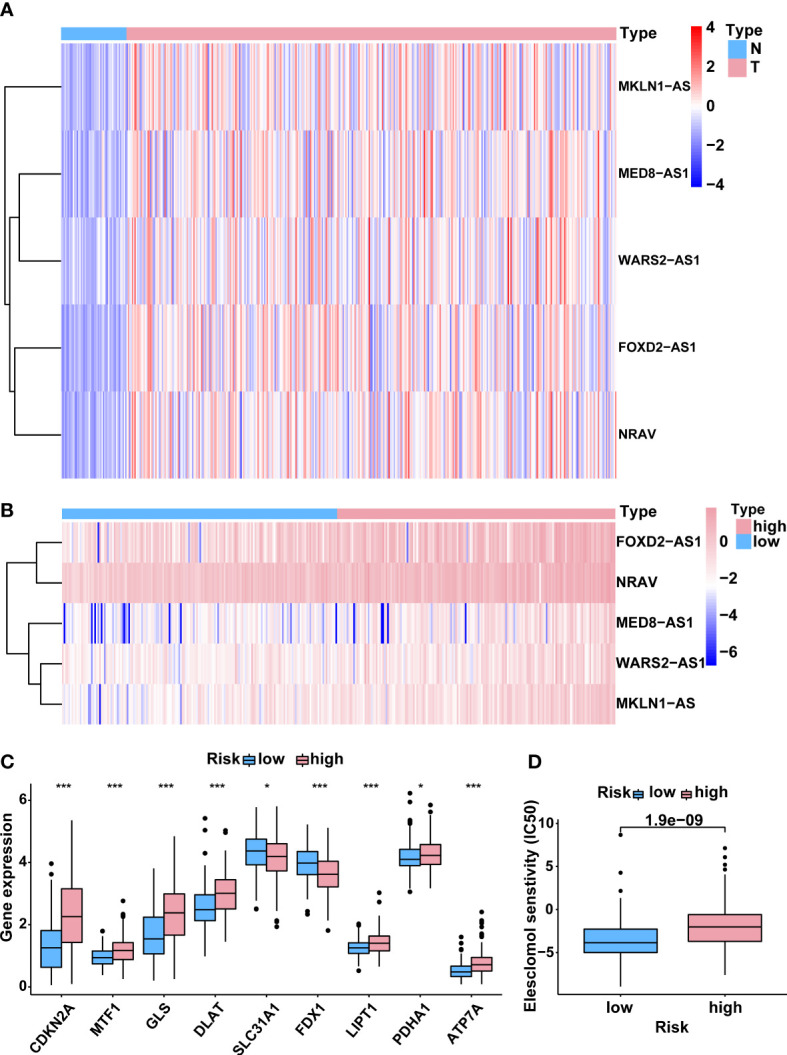
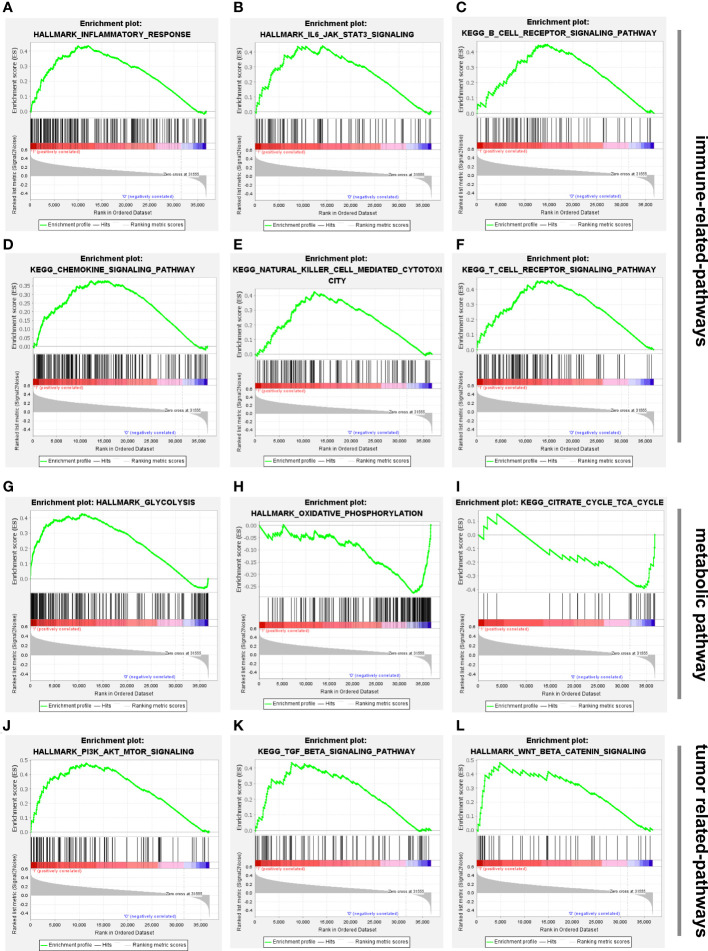
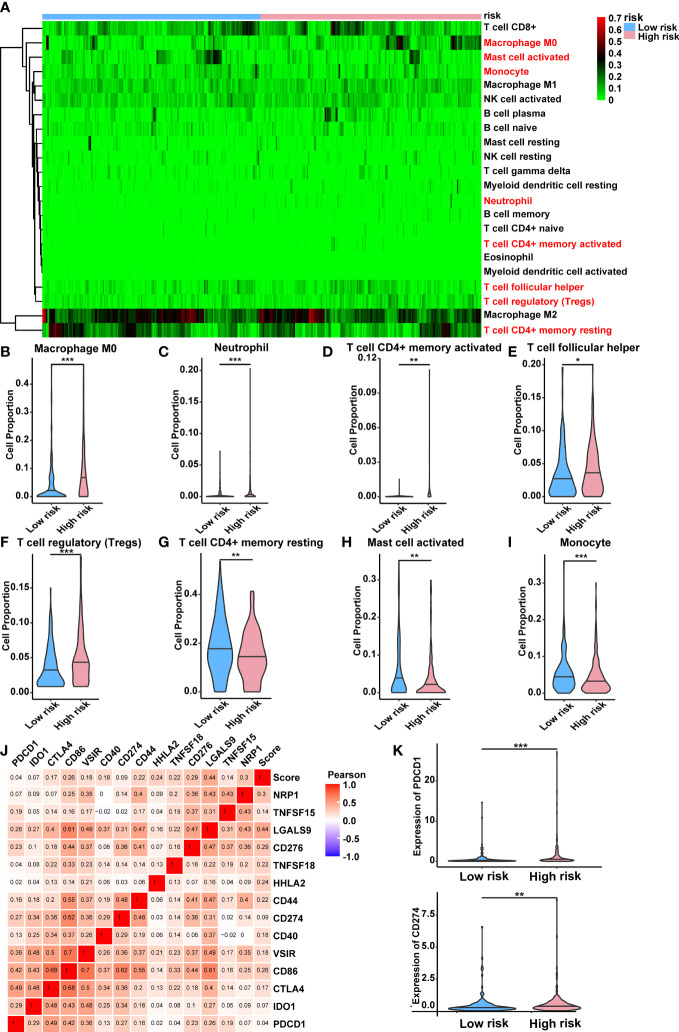
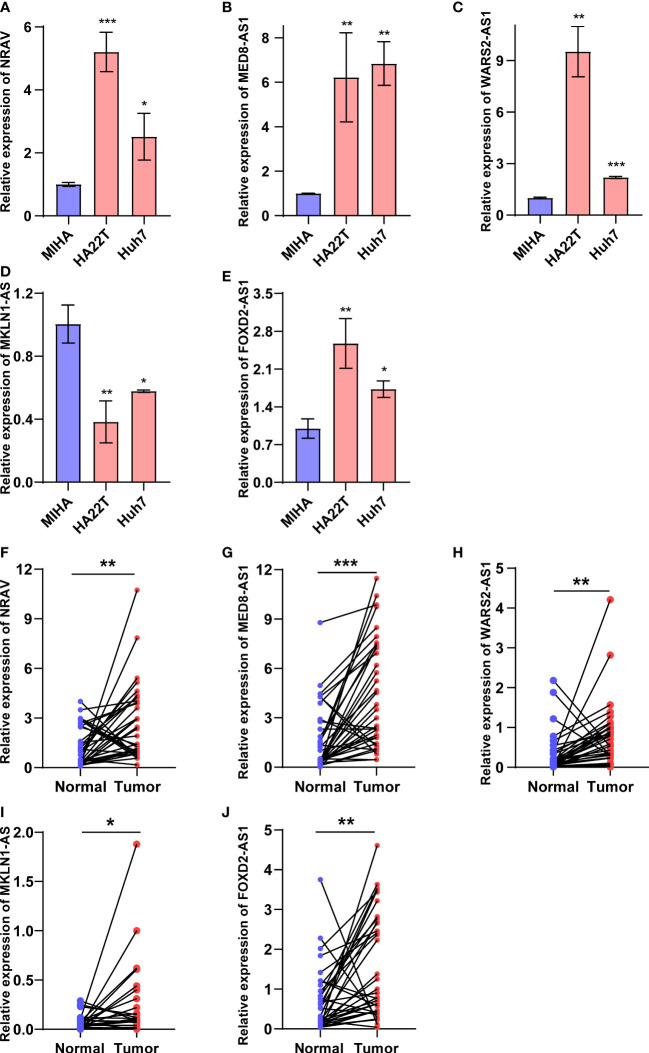
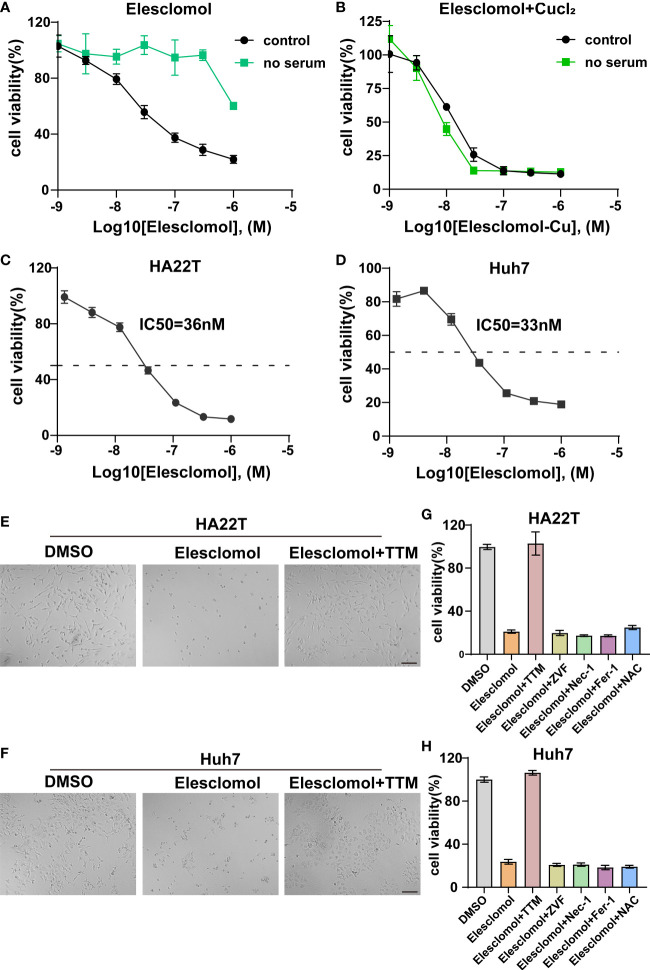
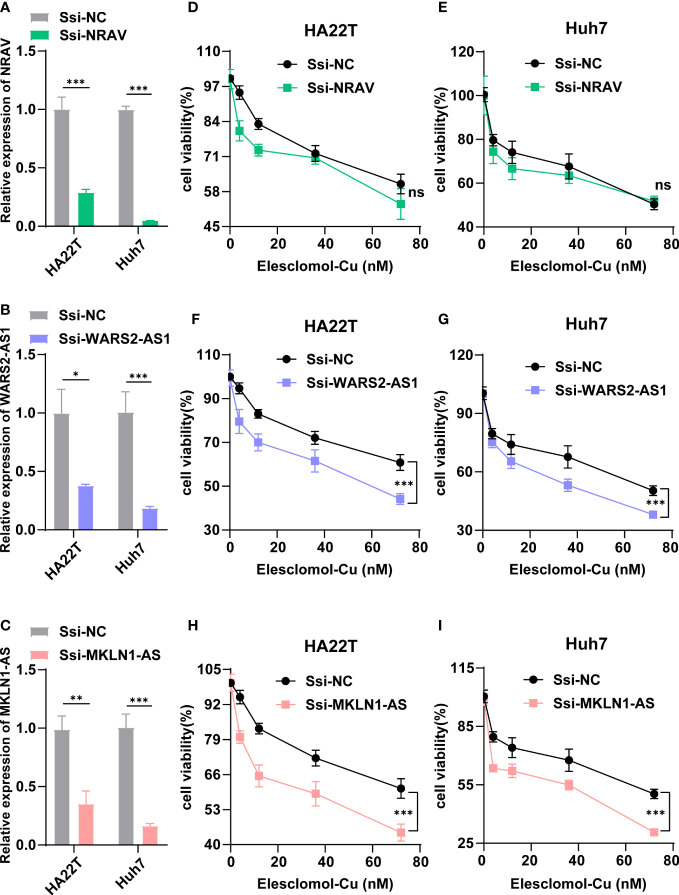
Cuproptosis was characterized as a novel type of programmed cell death. Recently, however, the role of cuproptosis-related long noncoding RNAs (CRLs) in tumors has not yet been studied. Identifying a predictive CRL signature in hepatocellular carcinoma (HCC) and investigating its putative molecular function were the goals of this work. Initially, Pearson's test was used to assess the relationship between lncRNAs and cuproptosis-associated genes obtained from HCC data of The Cancer Genome Atlas (TCGA). By implementing differential expression and univariate Cox analysis, 61 prognostic CRLs were subsequent to the least absolute shrinkage and selection operator (LASSO) Cox regression analysis. A prognostic risk score model was then constructed to evaluate its ability to predict patients' survival when combined with clinicopathological parameters in HCC. The five-lncRNA prognostic signature categorized the HCC patients into high- and low-risk groups. The low-risk group exhibited more sensitivity to elesclomol than the high-risk one. Surprisingly, distinct mitochondrial metabolism pathways connected to cuproptosis and pivotal immune-related pathways were observed between the two groups via gene set enrichment analysis (GSEA). Meanwhile, there were substantial differences between the high-risk group and the low-risk group in terms of tumor-infiltrating immune cells (TIICs). Furthermore, a positive relationship was shown between the risk score and the expression of immune checkpoints. Additionally, differential expression of the five lncRNAs was confirmed in our own HCC samples and cell lines via RT-qPCR. Finally, in vitro assays confirmed that WARS2-AS1 and MKLN1-AS knockdown could sensitize HCC cells to elesclomol-induced cuproptosis. Overall, our predictive signature may predict the prognosis of HCC patients in an independent manner, give a better understanding of how CRLs work in HCC, and offer therapeutic reference for patients with HCC.

Keywords: cuproptosis; hepatocellular carcinoma; immune microenvironment; lncRNA; survival analysis.


Conflict of interest statement

The authors declare that the research was conducted in the absence of any commercial or financial relationships that could be construed as a potential conflict of interest.

Figures

Figure 1
Figure 1
The flowchart of this work. HCC, hepatocellular carcinoma; TCGA, The Cancer Genome Atlas; DElncRNAs, differentially expressed lncRNAs; lncRNAs, long noncoding RNAs; ROC, receiver operating characteristic; GSEA, gene enrichment analysis.
Figure 2
Figure 2
Prognostic analysis of differentially expressed cuproptosis-related lncRNAs and the construction of a coexpression network. (A) Venn diagram identifying the lncRNAs shared by differentially expressed lncRNAs and cuproptosis-related lncRNAs. (B) Forest plots displaying the outcomes of the univariate cox regression analysis of about 61 prognostic differentially expressed CRLs. (C) The correlation between 61 prognostic CRLs and 13 CRGs in the TCGA-HCC cohort. Each unit’s color indicated the degree of correlation. Red implied the positive relationship, blue was on the contrary. (D) Coexpression network of 61 prognostic differentially expressed CRLs and CRGs based on the Pearson’s R>0.4 and P<0.001. (E) The Sankey diagram illustrated the link between the 61 prognostic differentially expressed CRLs and CRGs on the basis of Pearson’s R>0.4 and P<0.001. lncRNAs, long noncoding RNAs; CRLs, cuproptosis-associated lncRNAs; CRGs, cuproptosis-related genes; HCC, hepatocellular carcinoma. *p < 0.05, **p < 0.01, and ***p < 0.001.
Figure 3
Figure 3
Construction of a 5-cuproptosis-related-lncRNA signature and evaluation of its predictive value. (A, B) Cvfit and lambda curves demonstrating LASSO regression generated using a 10-fold cross-validation. (C, D) Results of the univariate and multivariate independent prognostic analysis in addressing the 5-cuproptosis-related lncRNA signature’s overall survival. (E) The nomogram model of age, gender, grade, stage, M, N, vascular invasion and risk score was used to forecast the 1-year, 3-year, and 5-year overall survival rate of HCC patient. (F-H) The calibration curves evaluated the congruence between the observed OS rates and the expected survival rates at 1, 3, and 5 years. The dashed grey diagonal line was the optimal nomogram. lncRNAs, long noncoding RNAs; LASSO, Least absolute shrinkage and selection operator; OS, overall survival; HCC, hepatocellular carcinoma; M, metastasis, N, lymph node.
Figure 4
Figure 4
Construction and validation of the cuproptosis-related lncRNA signature model in the overall, first internal and second internal cohorts. (A-C) The distribution and median value of the risk scores in the overall, first internal and second internal cohorts. (D-F) The distribution of overall survival status, survival time and risk score in the overall, first internal and second internal cohorts. (G-I) The Kaplan–Meier curves for survival status and survival time in the overall, first internal and second internal cohorts. (J-L) AUC of time-dependent ROC curves demonstrated the ability of the signature of prognostic cuproptosis-related lncRNAs to predict 1-, 2-, and 3-year OS in the overall, first internal and second internal cohorts. (M-O) AUC of ROC curves comparing the prognostic accuracy of the lncRNA signature model and other prognostic parameters in the overall, first internal and second internal cohorts. lncRNAs, long noncoding RNAs; ROC, receiver operating characteristic; AUC, area under the curve; OS, overall survival.
Figure 5
Figure 5
Correlation analysis between the prognostic signature and different clinicopathological characteristics in the TCGA cohort. (A) The heatmap illustrating the distribution of ten distinct clinicopathological features, together with the risk score for each patient based on the predictive signature. Clinicopathological features in red indicated that there was an obvious difference distributed in the high- and low-risk group. (B-I) Kaplan-Meier survival curves for high-risk and low-risk patient groups based on age, gender, TNM stage and grade classification. *p < 0.05, and ***p < 0.001.
Figure 6
Figure 6
Correlation between the predictive signature and cuproptosis. (A) The expression levels of 5 lncRNAs associated with cuproptosis in HCC and normal tissues. (B) The expression levels of 5 cuproptosis-related lncRNAs in groups with low and high risk. (C) The differential expression levels of CRGs between high- and low-risk groups. (D) Comparison of senstivity of cuproptosis inducer elesclomol between high- and low-risk groups. lncRNAs, long noncoding RNAs; HCC, hepatocellular carcinoma; CRGs, cuproptosis-related genes. *p < 0.05, and ***p < 0.001.
Figure 7
Figure 7
Biological functional and pathway enrichment analysis of high-risk group and low-risk group based on the cuproptosis-associated lncRNA signature via GSEA analysis. (A-F) GSEA showing significant enrichment of immune-related pathways in the high-risk HCC patients, including inflammatory response, IL6/JAK/STAT3 signaling, B cell receptor signaling pathway, chemokine signaling pathway, natural killer cell mediated-cytotoxicity and T cell receptor signaling pathway. (G-I) Glycolysis was mainly enriched in the high-risk group while oxidative phosphorylation and citrate cycle TCA cycle were related to low-risk group. (J-L) GSEA showing significant enrichment of tumor-related pathways in the high-risk HCC patients, including PI3K/AKT/mTOR, TGF-β signaling and wnt/β/cantenin pathways. lncRNAs, long noncoding RNAs; HCC, hepatocellular carcinoma; GSEA, gene enrichment analysis.
Figure 8
Figure 8
Relationship between the lncRNA-based signature and immune responses in HCC. (A) Relative proportion of 22 different immune cells based on CIBERSORT in the low-risk group and the high-risk group. Immune cells in red indicated that there was a significant difference within the two groups. (B-I) The proportion of M0 macrophages, neutrophil, activated memory CD4+ T cells, follicular helper T cells, regulatory T cells, activated mast cell, monocyte and resting memory CD4+ T cells in the low-risk group and the high-risk group. (J) Heat map showing the relations between risk score and various immune checkpoints via Pearson test. (K) PDCD1 and CD274 were significantly upregulated in the high-risk group. lncRNAs, long noncoding RNAs; HCC, hepatocellular carcinoma. *p < 0.05, **p < 0.01, and ***p < 0.001.
Figure 9
Figure 9
Validation of five cuproptosis-related lncRNAs expressions in HCC cell and tissues. (A-E) FOXD2-AS1, NRAV, MED8-AS1, WARS2-AS1 and MKLN1-AS expression in normal liver cells and HCC cells. (F-J) FOXD2-AS1, NRAV, MED8-AS1, WARS2-AS1 and MKLN1-AS expression in HCC tissues and adjacent normal tissues. *p < 0.05, **p < 0.01, and ***p < 0.001.
Figure 10
Figure 10
Validation of cuproptosis induced by elesclomol. (A) Cell viability of HCC cell when grown in the presence or absence of serum and treated with elesclomol. (B) Cell viability of HCC cell when grown in the presence or absence of serum and treated with either elesclomol or elesclomol in the presence of CuCl2. (C, D) HA22T and Huh7 cells were exposed to different doses of elesclomol for 24h and detected by CCK8 reagent. (E, F) Representative images of HCC cells treated with elesclomol (40nM) with or without TTM (5 μM) for 48h. Scale bars represent 200μm. (G, H) The rescue effect of cell death inhibitors on elesclomol treatment in HA22T and Huh7 was explored through CCK8 assay. Data was presented as mean+SD. ZVF, Z-VAD-FMK; Fer-1, ferrostatin-1; Nec-1, necrostatin-1; NAC, N-acetyl cysteine; TTM, Tetrathiomolybdate.
Figure 11
Figure 11
WARS2-AS1 and MKLN1-AS knockdown rendered cells susceptible for cuproptosis. (A-C) Relative NRAV, WARS2-AS1 and MKLN1-AS mRNA level in HCC cell with or without NRAV, WARS2-AS1 and MKLN1-AS knockdown (n=3). (D-I) HCC cells with or without NRAV, WARS2-AS1 and MKLN1-AS knockdown were exposed to different doses of elesclomol for 24h and detected by CCK8 reagent. SSi-NC, smart silencer negative control; *P < 0.05; **P < 0.01; ***P < 0.001; ns, no significant.

Similar articles

Cited by

References

    1. Bray F, Ferlay J, Soerjomataram I, Siegel RL, Torre LA, Jemal A. Global cancer statistics 2018: Globocan estimates of incidence and mortality worldwide for 36 cancers in 185 countries. CA Cancer J Clin (2018) 68:394–424. doi: 10.3322/caac.21492 - DOI - PubMed
    1. Singal AG, Lampertico P, Nahon P. Epidemiology and surveillance for hepatocellular carcinoma: New trends. J Hepatol (2020) 72:250–61. doi: 10.1016/j.jhep.2019.08.025 - DOI - PMC - PubMed
    1. Bruix J, Reig M, Sherman M. Evidence-based diagnosis, staging, and treatment of patients with hepatocellular carcinoma. Gastroenterology (2016) 150:835–53. doi: 10.1053/j.gastro.2015.12.041 - DOI - PubMed
    1. Llovet JM, Kelley RK, Villanueva A, Singal AG, Pikarsky E, Roayaie S, et al. Hepatocellular carcinoma. Nat Rev Dis Primers (2021) 7:6. doi: 10.1038/s41572-020-00240-3 - DOI - PubMed
    1. Raoul JL, Frenel JS, Raimbourg J, Gilabert M. Current options and future possibilities for the systemic treatment of hepatocellular carcinoma. Hepat Oncol (2019) 6:Hep11. doi: 10.2217/hep-2019-0001 - DOI - PMC - PubMed

Publication types