Comprehensive bulk and single-cell transcriptome profiling give useful insights into the characteristics of osteoarthritis associated synovial macrophages
- PMID: 36685529
- PMCID: PMC9849898
- DOI: 10.3389/fimmu.2022.1078414
Comprehensive bulk and single-cell transcriptome profiling give useful insights into the characteristics of osteoarthritis associated synovial macrophages
Abstract
Background: Osteoarthritis (OA) is a common chronic joint disease, but the association between molecular and cellular events and the pathogenic process of OA remains unclear.
Objective: The study aimed to identify key molecular and cellular events in the processes of immune infiltration of the synovium in OA and to provide potential diagnostic and therapeutic targets.
Methods: To identify the common differential expression genes and function analysis in OA, we compared the expression between normal and OA samples and analyzed the protein-protein interaction (PPI). Additionally, immune infiltration analysis was used to explore the differences in common immune cell types, and Gene Set Variation Analysis (GSVA) analysis was applied to analyze the status of pathways between OA and normal groups. Furthermore, the optimal diagnostic biomarkers for OA were identified by least absolute shrinkage and selection operator (LASSO) models. Finally, the key role of biomarkers in OA synovitis microenvironment was discussed through single cell and Scissor analysis.
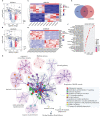
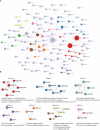
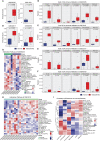
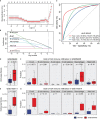
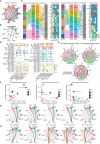
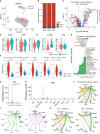
Results: A total of 172 DEGs (differentially expressed genes) associated with osteoarticular synovitis were identified, and these genes mainly enriched eight functional categories. In addition, immune infiltration analysis found that four immune cell types, including Macrophage, B cell memory, B cell, and Mast cell were significantly correlated with OA, and LASSO analysis showed that Macrophage were the best diagnostic biomarkers of immune infiltration in OA. Furthermore, using scRNA-seq dataset, we also analyzed the cell communication patterns of Macrophage in the OA synovial inflammatory microenvironment and found that CCL, MIF, and TNF signaling pathways were the mainly cellular communication pathways. Finally, Scissor analysis identified a population of M2-like Macrophages with high expression of CD163 and LYVE1, which has strong anti-inflammatory ability and showed that the TNF gene may play an important role in the synovial microenvironment of OA.
Conclusion: Overall, Macrophage is the best diagnostic marker of immune infiltration in osteoarticular synovitis, and it can communicate with other cells mainly through CCL, TNF, and MIF signaling pathways in microenvironment. In addition, TNF gene may play an important role in the development of synovitis.
Keywords: Scissor analysis; immune infiltration; macrophage; osteoarthritis; synovium.
Copyright © 2023 Liao, Yang, Li, Wu, Sun, Lu, Liu, Deng, Wang, Xie, Tang, Nie and Fan.
Conflict of interest statement
The authors declare that the research was conducted in the absence of any commercial or financial relationships that could be construed as a potential conflict of interest.
Figures
Similar articles
-
Comprehensive multiomics analysis identifies PYCARD as a key pyroptosis-related gene in osteoarthritis synovial macrophages.Front Immunol. 2025 Mar 24;16:1558139. doi: 10.3389/fimmu.2025.1558139. eCollection 2025. Front Immunol. 2025. PMID: 40196125 Free PMC article.
-
Comprehensive Analysis of Programmed Cell Death-Related Genes in Diagnosis and Synovitis During Osteoarthritis Development: Based on Bulk and Single-Cell RNA Sequencing Data.J Inflamm Res. 2025 Jan 17;18:751-778. doi: 10.2147/JIR.S491203. eCollection 2025. J Inflamm Res. 2025. PMID: 39839184 Free PMC article.
-
Development and validation of cuproptosis-related genes in synovitis during osteoarthritis progress.Front Immunol. 2023 Feb 2;14:1090596. doi: 10.3389/fimmu.2023.1090596. eCollection 2023. Front Immunol. 2023. PMID: 36817415 Free PMC article.
-
Role of Mesenchymal Stem Cells and Their Paracrine Mediators in Macrophage Polarization: An Approach to Reduce Inflammation in Osteoarthritis.Int J Mol Sci. 2022 Oct 27;23(21):13016. doi: 10.3390/ijms232113016. Int J Mol Sci. 2022. PMID: 36361805 Free PMC article. Review.
-
Macrophages regulate the progression of osteoarthritis.Osteoarthritis Cartilage. 2020 May;28(5):555-561. doi: 10.1016/j.joca.2020.01.007. Epub 2020 Jan 23. Osteoarthritis Cartilage. 2020. PMID: 31982565 Review.
Cited by
-
Identification of immune microenvironment subtypes and clinical risk biomarkers for osteoarthritis based on a machine learning model.Front Mol Biosci. 2024 Oct 17;11:1376793. doi: 10.3389/fmolb.2024.1376793. eCollection 2024. Front Mol Biosci. 2024. PMID: 39484639 Free PMC article.
-
Research progress and hotspots on macrophages in osteoarthritis: A bibliometric analysis from 2009 to 2022.Medicine (Baltimore). 2023 Aug 25;102(34):e34642. doi: 10.1097/MD.0000000000034642. Medicine (Baltimore). 2023. PMID: 37653729 Free PMC article.
-
Mendelian randomization and transcriptome analysis identified immune-related biomarkers for osteoarthritis.Front Immunol. 2024 Apr 12;15:1334479. doi: 10.3389/fimmu.2024.1334479. eCollection 2024. Front Immunol. 2024. PMID: 38680491 Free PMC article.
-
Recent advances in omics and the integration of multi-omics in osteoarthritis research.Arthritis Res Ther. 2025 May 3;27(1):100. doi: 10.1186/s13075-025-03563-2. Arthritis Res Ther. 2025. PMID: 40319309 Free PMC article. Review.
-
Emerging Roles of Macrophage Polarization in Osteoarthritis: Mechanisms and Therapeutic Strategies.Orthop Surg. 2024 Mar;16(3):532-550. doi: 10.1111/os.13993. Epub 2024 Jan 31. Orthop Surg. 2024. PMID: 38296798 Free PMC article. Review.
References
-
- Sinusas K. Osteoarthritis: Diagnosis and treatment. Am Fam Physician (2012) 85(1):49–56. Available at: https://www.aafp.org/dam/brand/aafp/pubs/afp/issues/2012/0101/p49.pdf - PubMed
Publication types
MeSH terms
Substances
LinkOut - more resources
Full Text Sources
Medical
Research Materials
Miscellaneous

