

Investigating regulatory patterns of NLRP3 Inflammasome features and association with immune microenvironment in Crohn's disease
- PMID: 36685554
- PMCID: PMC9849378
- DOI: 10.3389/fimmu.2022.1096587
Investigating regulatory patterns of NLRP3 Inflammasome features and association with immune microenvironment in Crohn's disease
Abstract
Introduction: Crohn's disease is characterized of dysregulated inflammatory and immune reactions. The role of the NOD-like receptor family, pyrin domain-containing 3 (NLRP3) inflammasome in Crohn's disease remains largely unknown.
Methods: The microarray-based transcriptomic data and corresponding clinical information of GSE100833 and GSE16879 were obtained from the Gene Expression Omnibus (GEO) database. Identification of in the NLRP3 inflammasome-related genes and construction of LASSO regression model. Immune landscape analysis was evaluated with ssGSEA. Classification of Crohn's-disease samples based on NLRP3 inflammasome-related genes with ConsensusClusterPlus. Functional enrichment analysis, gene set variation analysis (GSVA) and drug-gene interaction network.
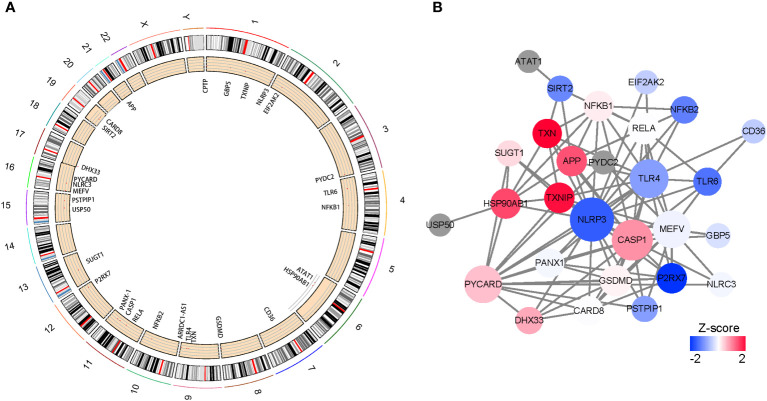
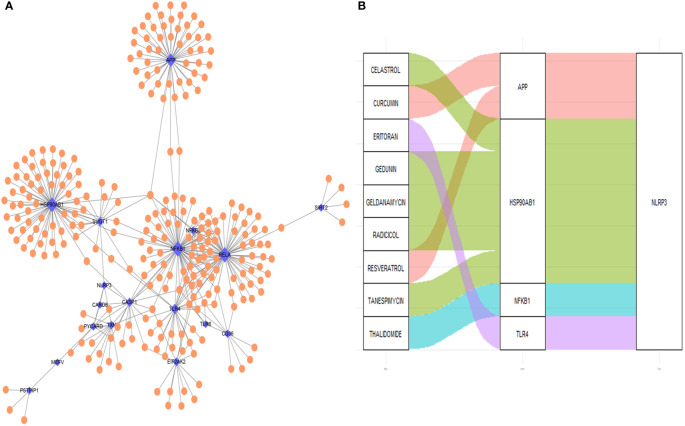
Results: The expressions of NLRP3 inflammasome-related genes were increased in diseased tissues, and higher expressions of NLRP3 inflammasome-related genes were correlated with generally enhanced immune cell infiltration, immune-related pathways and human leukocyte antigen (HLA)-gene expressions. The gene-based signature showed well performance in the diagnosis of Crohn's disease. Moreover, consensus clustering identified two Crohn's disease clusters based on NLRP3 inflammasome-related genes, and cluster 2 was with higher expressions of the genes. Cluster 2 demonstrated upregulated activities of immune environment in Crohn's disease. Furthermore, four key hub genes were identified and potential drugs were explored for the treatment of Crohn's disease.
Conclusions: Our findings indicate that NLRP3 inflammasome and its related genes could regulate immune cells and responses, as well as involve in the pathogenesis of Crohn's disease from transcriptomic aspects. These findings provide in silico insights into the diagnosis and treatment of Crohn's disease and might assist in the clinical decision-making process.
Keywords: Crohn’s disease; NLRP3 inflammasome; drug; immune landscape; treatment.
Copyright © 2023 Wu, Zeng, Qiu, Chen, Zhuo, Guo, Xiang, Yang, Jiang, Leung, Lian, Sha and Chen.
Conflict of interest statement
The authors declare that the research was conducted in the absence of any commercial or financial relationships that could be construed as a potential conflict of interest. The reviewer HY declared a shared parent affiliation with the author, KC, to the handling editor at the time of the review.
Figures


Similar articles
-
Herb-partitioned moxibustion alleviates colonic inflammation in Crohn's disease rats by inhibiting hyperactivation of the NLRP3 inflammasome via regulation of the P2X7R-Pannexin-1 signaling pathway.PLoS One. 2021 May 27;16(5):e0252334. doi: 10.1371/journal.pone.0252334. eCollection 2021. PLoS One. 2021. PMID: 34043726 Free PMC article.
-
The Pathogenic Role of NLRP3 Inflammasome Activation in Inflammatory Bowel Diseases of Both Mice and Humans.J Crohns Colitis. 2017 Jun 1;11(6):737-750. doi: 10.1093/ecco-jcc/jjw219. J Crohns Colitis. 2017. PMID: 27993998 Free PMC article.
-
Activation of NLRP3 Inflammasome in Inflammatory Bowel Disease: Differences Between Crohn's Disease and Ulcerative Colitis.Dig Dis Sci. 2017 Sep;62(9):2348-2356. doi: 10.1007/s10620-017-4609-8. Epub 2017 May 18. Dig Dis Sci. 2017. PMID: 28523573
-
Targeting NLRP3 Inflammasome in Inflammatory Bowel Disease: Putting out the Fire of Inflammation.Inflammation. 2019 Aug;42(4):1147-1159. doi: 10.1007/s10753-019-01008-y. Inflammation. 2019. PMID: 30937839 Review.
-
Posttranslational Regulation of the NLR Family Pyrin Domain-Containing 3 Inflammasome.Front Immunol. 2018 May 18;9:1054. doi: 10.3389/fimmu.2018.01054. eCollection 2018. Front Immunol. 2018. PMID: 29868015 Free PMC article. Review.
Cited by
-
Characterizing hedgehog pathway features in senescence associated osteoarthritis through Integrative multi-omics and machine learning analysis.Front Genet. 2024 Feb 20;15:1255455. doi: 10.3389/fgene.2024.1255455. eCollection 2024. Front Genet. 2024. PMID: 38444758 Free PMC article.
-
Development of a risk model to predict prognosis in breast cancer based on cGAS-STING-related genes.Front Genet. 2023 Mar 27;14:1121018. doi: 10.3389/fgene.2023.1121018. eCollection 2023. Front Genet. 2023. PMID: 37051596 Free PMC article.
-
SLC6A14 promotes ulcerative colitis progression by facilitating NLRP3 inflammasome-mediated pyroptosis.World J Gastroenterol. 2024 Jan 21;30(3):252-267. doi: 10.3748/wjg.v30.i3.252. World J Gastroenterol. 2024. PMID: 38314135 Free PMC article.
-
Gut Microbiota, Inflammatory Bowel Disease, and Cancer: The Role of Guardians of Innate Immunity.Cells. 2023 Nov 19;12(22):2654. doi: 10.3390/cells12222654. Cells. 2023. PMID: 37998389 Free PMC article. Review.
-
The causal relationship between anti-diabetic drugs and gastrointestinal disorders: a drug-targeted mendelian randomization study.Diabetol Metab Syndr. 2024 Jun 26;16(1):141. doi: 10.1186/s13098-024-01359-z. Diabetol Metab Syndr. 2024. PMID: 38918852 Free PMC article.
References
-
- Vadstrup K, Alulis S, Borsi A, Gustafsson N, Nielsen A, Wennerström ECM, et al. . Cost burden of crohn’s disease and ulcerative colitis in the 10-year period before diagnosis–a Danish register-based study from 2003–2015. Inflammatory Bowel Dis (2020) 26:1377–82. doi: 10.1093/ibd/izz265 - DOI - PMC - PubMed
Publication types
MeSH terms
Substances
LinkOut - more resources
Full Text Sources
Medical
Research Materials