. 2023 Jan 6:13:1036672.
doi: 10.3389/fimmu.2022.1036672. eCollection 2022.

Increased Myosin light chain 9 expression during Kawasaki disease vasculitis

Affiliations

Increased Myosin light chain 9 expression during Kawasaki disease vasculitis

Hironobu Kobayashi et al. Front Immunol. .

Abstract

Introduction: Kawasaki disease (KD) is an acute systemic vasculitis that predominantly afflicts children. KD development is known to be associated with an aberrant immune response and abnormal platelet activation, however its etiology is still largely unknown. Myosin light chain 9 (Myl9) is known to regulate cellular contractility of both non-muscle and smooth muscle cells, and can be released from platelets, whereas any relations of Myl9 expression to KD vasculitis have not been examined.

Methods: Plasma Myl9 concentrations in KD patients and children with febrile illness were measured and associated with KD clinical course and prognosis. Myl9 release from platelets in KD patients was also evaluated in vitro. Myl9 expression was determined in coronary arteries from Lactobacillus casei cell wall extract (LCWE)-injected mice that develop experimental KD vasculitis, as well as in cardiac tissues obtained at autopsy from KD patients.

Results and discussion: Plasma Myl9 levels were significantly higher in KD patients during the acute phase compared with healthy controls or patients with other febrile illnesses, declined following IVIG therapy in IVIG-responders but not in non-responders. In vitro, platelets from KD patients released Myl9 independently of thrombin stimulation. In the LCWE-injected mice, Myl9 was detected in cardiac tissue at an early stage before inflammatory cell infiltration was observed. In tissues obtained at autopsy from KD patients, the highest Myl9 expression was observed in thrombi during the acute phase and in the intima and adventitia of coronary arteries during the chronic phase. Thus, our studies show that Myl9 expression is significantly increased during KD vasculitis and that Myl9 levels may be a useful biomarker to estimate inflammation and IVIG responsiveness to KD.

Keywords: CD69; Kawasaki disease; Myl9; children; coronary artery; platelet; vasculitis.


Conflict of interest statement

The authors declare that the research was conducted in the absence of any commercial or financial relationships that could be construed as a potential conflict of interest.

Figures
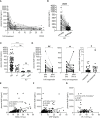
Figure 1
Figure 1
Plasma Myl9 levels correlate with KD clinical course. (A) A time-course analysis of plasma Myl9 levels in 36 KD patients who responded to IVIG treatment. Day 0 values are values of samples obtained just before IVIG treatment, and the same patient samples are connected by a line. (B) Comparison of the plasma Myl9 levels in the acute phase (pre-IVIG and at discharge of KD patients (n=54). The same patient samples are connected by a line. ####P < 0.0001 (single comparisons, Wilcoxon signed-rank test without correction). (C) Comparison of the plasma Myl9 levels in the acute phase of KD patients (n=76), patients with febrile illness (FI) (n=16), child healthy volunteers (HV) (n=8), and adult HV (n=9). ****P < 0.0001 (multiple comparisons, one-way ANOVA), *P < 0.05. ns, not significant. Data are shown as the mean ± SEM. (D) Myl9 levels of KD patients before (day 0) and after (day 2-3) IVIG treatment, including both IVIG responders (n=36) (left) and non-responders (n=18) (middle). Myl9 level ratio (post/pre-IVIG) of IVIG responders (n=36) and non-responders (n=18) (right). The same patient samples are connected by a line. Plasma Myl9 levels decreased significantly after IVIG treatment in the IVIG responder group. ##P < 0.01 (single comparisons, Wilcoxon signed-rank test without correction), #P < 0.05. ns, not significant. Data are shown as the median with interquartile range. (E, F) The relationship between plasma Myl9 levels and the white blood cell (WBC) counts (D), or CRP levels (E) (n=415). Plots show samples from 76 KD patients in the acute to convalescent phase. (G) The relationship between the maximum plasma Myl9 levels and the minimum platelet (PLT) counts in each KD patient (n=76).
Figure 2
Figure 2
Myl9 and CD69 expression in peripheral blood mononuclear cells (PBMCs) in KD patients. (A) Myl9 release from platelets of KD patients (n=9) in the acute phase of the disease in comparison to HV (n=5), with or without in vitro stimulation with thrombin. The graph indicates the ratio of the Myl9 levels released with stimulation to those released without stimulation. ##P < 0.01 (single comparisons, Mann-Whitney U test without correction). Data are shown as the mean ± SEM. (B) Myl9 release from platelets of KD patients (n=9) in the acute phase of the disease and HV (n=5), with or without in vitro stimulation with thrombin. #P < 0.05 (single comparisons, Mann-Whitney U test without correction). Data are shown as the mean ± SEM. (C) Flow cytometric analysis showing CD69-expressing PBMCs in a KD patient (IVIG responder) in the acute phase, in the convalescent phase (1 month after IVIG treatment), and in a child HV. The right graph shows the percentage of CD69-positive PBMCs of KD patients in the acute and convalescent phase (n=6) and HV (n=3). The same patient samples are connected by a line. #P < 0.05 (single comparisons, Wilcoxon signed-rank test without correction). ns, not significant. Data are shown as the mean ± SEM. (D) Plasma Myl9 levels of KD patients in the acute phase and convalescent phase (n=6). These samples were taken from the patients at the same time as the analysis shown in (C) #P < 0.05 (single comparisons, Wilcoxon signed-rank test without correction).
Figure 3
Figure 3
Myl9/12 expression in coronary arteries of LCWE-injected mice. (A) Schematic outline of the LCWE-induced KD vasculitis murine model. Five-week-old WT male mice were intraperitoneally (i.p.) injected with 500µg of LCWE and 14 days later heart tissues were collected and analyzed. (B) Representative pictures of heart tissues collected from control mice and LCWE-injected mice developing vasculitis (left). HE staining of serial sections of coronary arteries of a control mouse (upper) and a LCWE-injected mouse (lower). Five consecutive sections were prepared at 100 μm intervals from the proximal side of the coronary artery origin (section #1) to the distal side (section #5) as shown in the enlarged photograph (upper). Red triangle indicates inflammatory change. Black scale bars indicate 500 μm. CA, coronary artery; Ao, aorta. (C) The inflammation scores of serial sections of coronary arteries of the LCWE-injected mice in B are shown (100 tissue sections from 20 mice). Each dot shows the inflammation score from each section. (D) HE staining (left) and IHC staining of the coronary artery in a control mouse (upper) and an LCWE-injected mouse (lower) using goat anti-CD69 Ab (white), goat IgG isotype Ab, rabbit anti-Myl9/12 Ab (green), rabbit IgG isotype Ab, and anti-α-SMA Ab (red). The coronary artery is surrounded by a black (HE) or white square (IHC), and the indicated area is shown in a high-power field (lower). Scale bars indicate 500 μm (low-power field) and 100 μm (high-power field). (E) The fluorescence intensity of Myl9/12 in the pericoronary artery region (left) and coronary artery wall (right) using the section #1, comparison between control mice (n=12), and LCWE-injected mice (n=12), normalized to isotype controls was shown. Data are shown as the mean ± SEM. ####P < 0.0001 (single comparisons, Mann-Whitney U test without correction), ###P < 0.001. Data are shown as the mean ± SEM.
Figure 4
Figure 4
Myl9/12 is detected in coronary arteries of LCWE-injected mice prior to the infiltration of inflammatory cells. (A) HE staining (upper) and IHC staining using anti-Myl9/12 Ab (lower) of the proximal side (section #1 indicated in Figure 3B ) of the coronary artery in a control mouse (left) and an LCWE-injected mouse at 3 days (middle) and 7 days (right) after the administration of LCWE. Scale bars indicate 500 μm (low-power field) and 100 μm (high-power field). CA, coronary artery; Ao, aorta. (B) Inflammation scores of five consecutive sections of the coronary arteries of LCWE-injected mice on day 0 (d0, n=5), day 3 (LCWE d3, n=5), and day 7 (LCWE d7, n=5) after the administration of LCWE. Section #1 is the most proximal side, and section #5 is the most distal side of the origin of the coronary artery (left). The inflammation scores using section#1 compared among d0, d3 and d7 was shown (right). **P < 0.01 (multiple comparisons, one-way ANOVA), ns; not significant. Data are shown as the mean ± SEM. (C) The fluorescence intensity of Myl9/12 in the pericoronary artery region (left and middle) and in the coronary artery wall (right) among control mice (d0, n=5), and LCWE-injected mice on day 3 (LCWE d3, n=5) and day 7 (LCWE d7, n=5) after the administration of LCWE. Section #1 is the most proximal side and #5 is the most distal side (left). The fluorescence intensity of Myl9/12 in the peri-coronary artery (middle) and in the coronary artery wall (right) using the section #1 compared among d0, d3 and d7 was shown. Data were normalized to controls. *P < 0.05 (multiple comparisons, one-way ANOVA). ns, not significant. Data are shown as the mean ± SEM.
Figure 5
Figure 5
Myl9/12 expression in heart tissues collected from KD patients. (A) Elastica-van Gieson (EVG) staining of the coronary artery in a control patient (left), KD patients who died on the 14th day of illness (2nd from left), at 1 year after illness (3rd from left), and 2 years after illness (right). Each upper figure shows the coronary artery (giant coronary artery aneurysm in KD patients), and the area surrounded by the square indicates a high-power field. The double-headed arrow indicates medial smooth muscle in the control patient. (B) HE staining of the same area shown in (A) Black square indicates thrombus, black arrowhead indicates white thrombus. (C) Myl9/12 staining of the same area shown in (A, B) Double-headed arrow indicates medial smooth muscle. Black arrowhead indicates white thrombus.

References

    1. Burns JC, Glodé MP. Kawasaki Syndrome. Lancet (2004) 364(9433):533–44. doi: 10.1016/s0140-6736(04)16814-1 - DOI - PubMed
    1. McCrindle BW, Rowley AH, Newburger JW, Burns JC, Bolger AF, Gewitz M, et al. . Diagnosis, treatment, and long-term management of Kawasaki disease: A scientific statement for health professionals from the American heart association. Circulation (2017) 135(17):e927–e99. doi: 10.1161/CIR.0000000000000484 - DOI - PubMed
    1. Fukazawa R, Kobayashi J, Ayusawa M, Hamada H, Miura M, Mitani Y, et al. . JCS/JSCS 2020 guideline on diagnosis and management of cardiovascular sequelae in Kawasaki disease. Circ J (2020) 84(8):1348–407. doi: 10.1253/circj.CJ-19-1094 - DOI - PubMed
    1. Newburger JW, Takahashi M, Burns JC, Beiser AS, Chung KJ, Duffy CE, et al. . The treatment of Kawasaki syndrome with intravenous gamma globulin. N Engl J Med (1986) 315(6):341–7. doi: 10.1056/nejm198608073150601 - DOI - PubMed
    1. Burns JC, Franco A. The immunomodulatory effects of intravenous immunoglobulin therapy in Kawasaki disease. Expert Rev Clin Immunol (2015) 11(7):819–25. doi: 10.1586/1744666x.2015.1044980 - DOI - PMC - PubMed

Publication types

MeSH terms

Substances