

Functional status and spatial interaction of T cell subsets driven by specific tumor microenvironment correlate with recurrence of non-small cell lung cancer
- PMID: 36685566
- PMCID: PMC9846487
- DOI: 10.3389/fimmu.2022.1022638
Functional status and spatial interaction of T cell subsets driven by specific tumor microenvironment correlate with recurrence of non-small cell lung cancer
Abstract
Background: The anti-tumoral or pro-tumoral roles of CD4+ and CD8+ T cells typify the complexity of T cell subsets function in cancer. In the non-small cell lung cancer (NSCLC), the density and topology of distinct T cell phenotypes at the tumor center (TC) versus the invasive margin (IM) are largely unknown. Here, we investigated T cell subsets density and distribution within TC and IM regions in NSCLC and its impact on the prognosis.
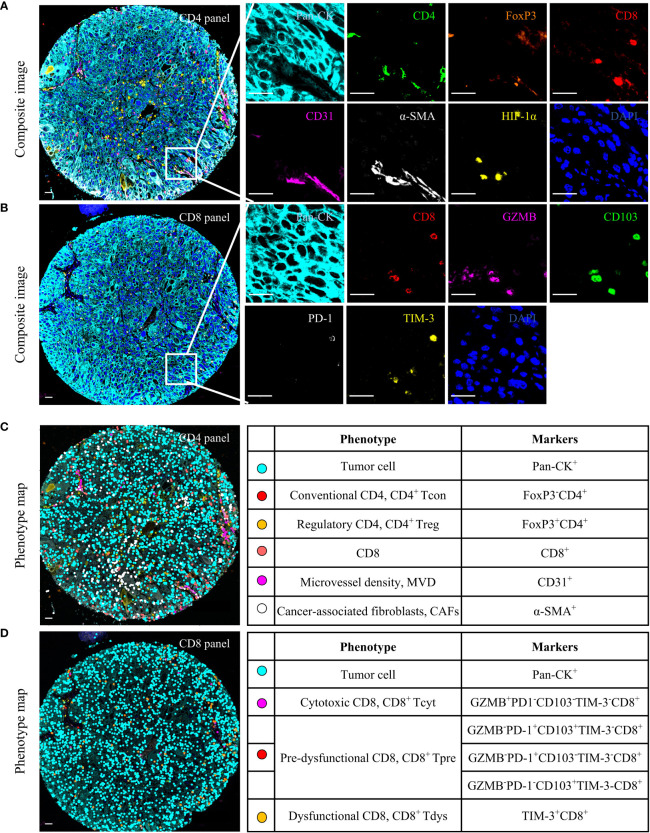
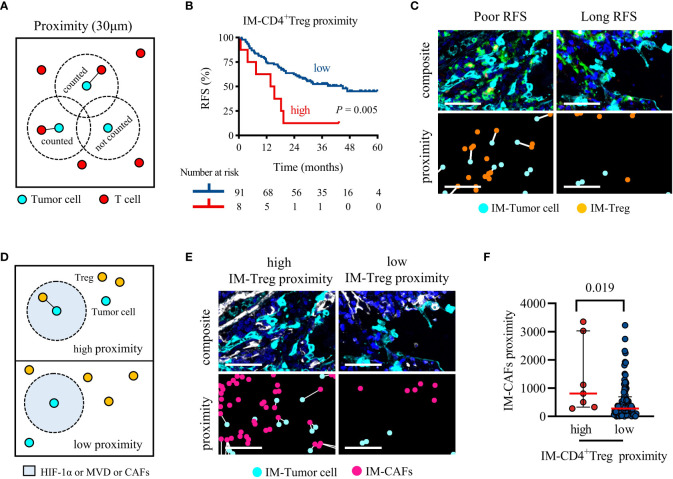
Methods: We performed multiplex immunofluorescence using a tissue microarray of samples from 99 patients with locally advanced NSCLC to elucidate the distributions of tumor cell, T cell subpopulations (CD4/conventional CD4/regulatory CD4/CD8/cytotoxic CD8/pre-dysfunctional CD8/dysfunctional CD8), microvessel density (MVD), cancer-associated fibroblasts (CAFs) and hypoxia-inducible factor-1α (HIF-1α) in TC and IM tissues. Cell-to-cell nearest neighbor distances and interactions were analyzed using the phenoptrreports R package. Cox regression was used to evaluate the associations between T cell subsets density and proximity to tumor cells and recurrence-free survival (RFS). Correlations between different cell subsets were examined by Spearman's or Kruskal-Wallis tests.
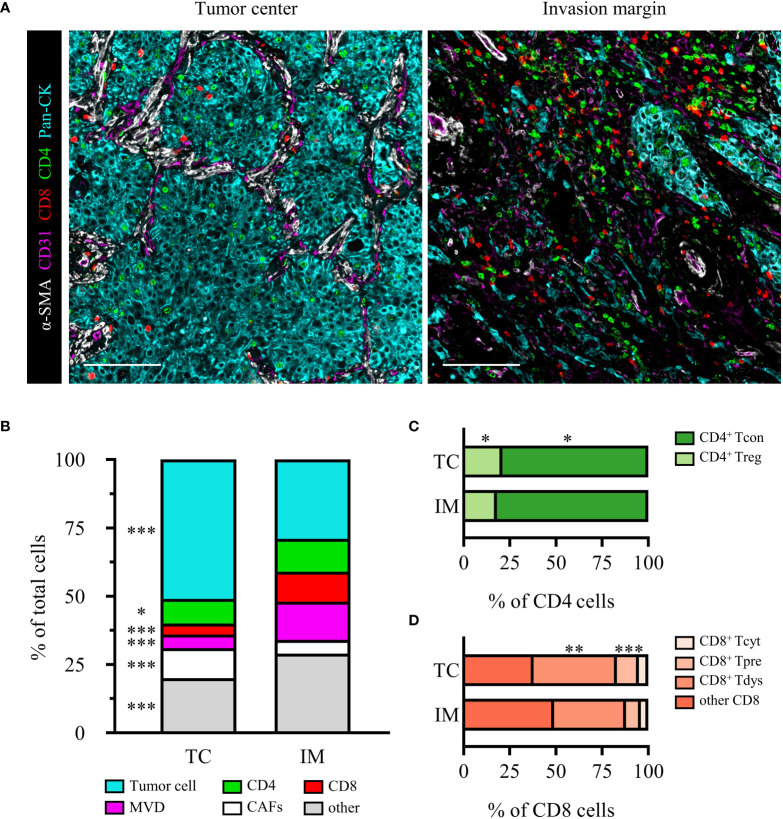
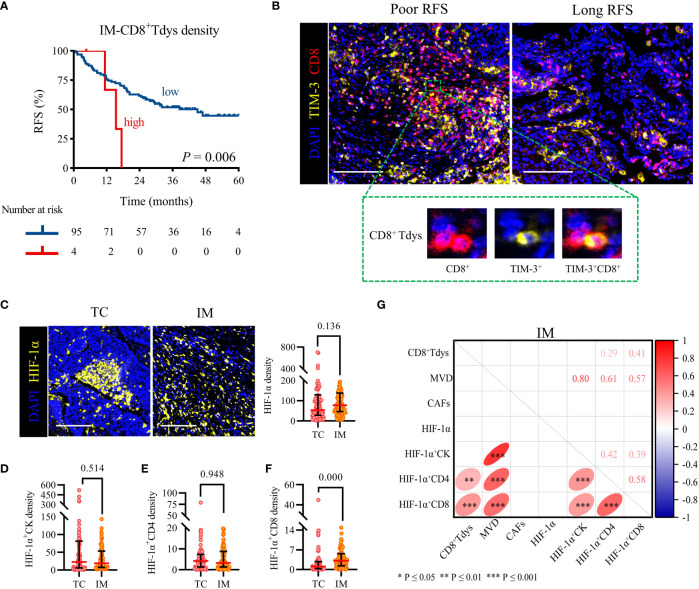
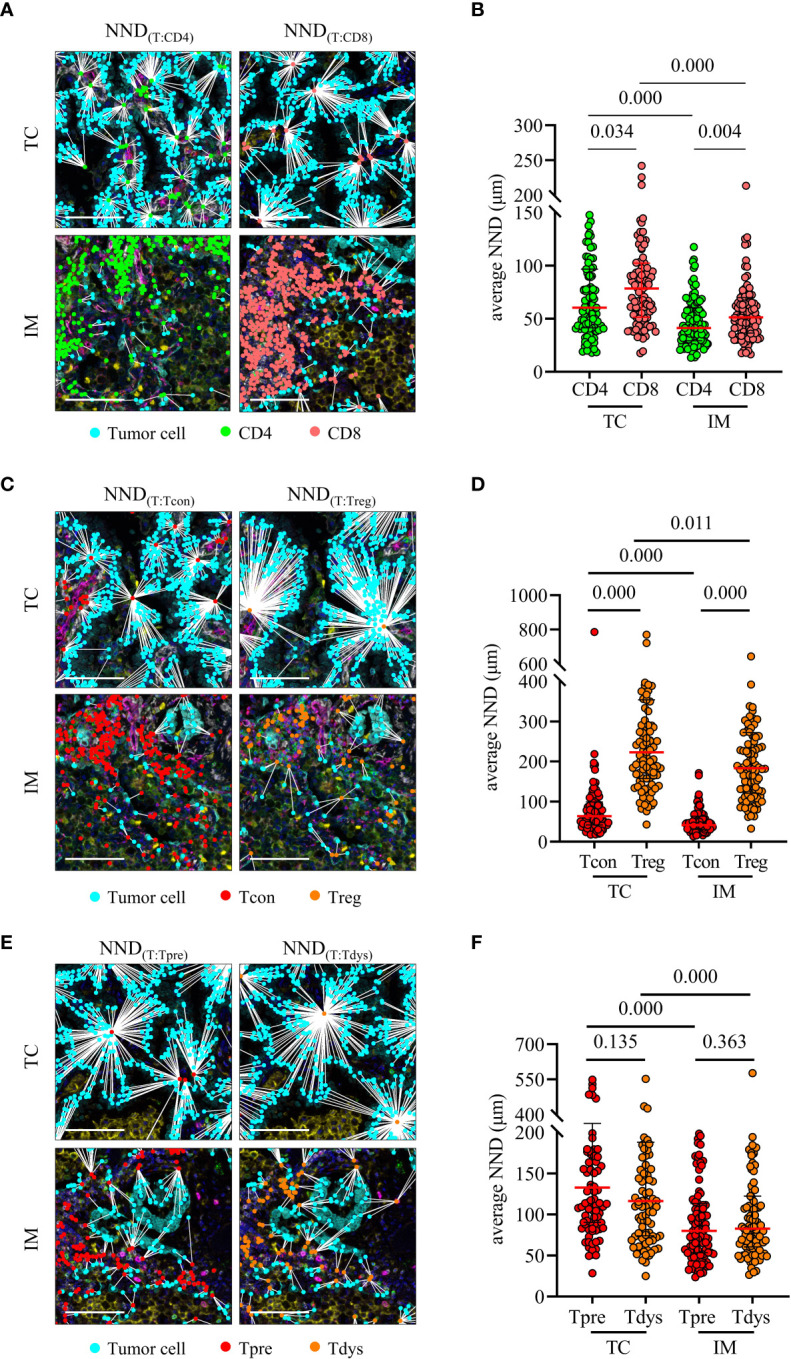
Results: In the locally advanced NSCLC, the proportion of tumor cells and CAFs in IM is lower than in the TC, while MVD, CD4+, and CD8+ T lymphocytes were increased, and tumor cells were closer to T lymphocytes and their subsets. The density and proximity of CD4+ and CD8+ T cells in the TC and IM regions were not associated with RFS, but in the IM area, increased density of dysfunctional CD8 and closer regulatory CD4 to tumor cells were independent risk factors for recurrence (HR were 3.536 and 2.884, respectively), and were positively correlated with HIF-1α+CD8 (r = 0.41, P = 0.000) and CAFs (P = 0.017), respectively.s.
Conclusions: In locally advanced NSCLC, the functional status of T cells in the IM region is closely related to recurrence. The density of dysfunctional CD8 and the proximity of regulatory CD4 to tumor cells were independent risk factors for recurrence, and are positively correlated with the hypoxia response of CD8+ T cells and CAFs. Targeting hypoxia or CAFs is expected to further sensitize therapy.
Keywords: CD4; CD8; functional status; lung cancer; prognostic; spatial interaction.
Copyright © 2023 Yang, Zhang, Sun, Yang, Cai, Sun, Xing and Sun.
Conflict of interest statement
The authors declare that the research was conducted in the absence of any commercial or financial relationships that could be construed as a potential conflict of interest.
Figures
Similar articles
-
Functional status and spatial architecture of tumor-infiltrating CD8+ T cells are associated with lymph node metastases in non-small cell lung cancer.J Transl Med. 2023 May 12;21(1):320. doi: 10.1186/s12967-023-04154-y. J Transl Med. 2023. PMID: 37173705 Free PMC article.
-
[Joint analysis of invasive margins and tumor center to evaluate the prognostic value of bystander CD8+ T cells in early-stage non-small cell lung cancer].Zhonghua Zhong Liu Za Zhi. 2025 Jun 23;47(6):508-516. doi: 10.3760/cma.j.cn112152-20240805-00326. Zhonghua Zhong Liu Za Zhi. 2025. PMID: 40534266 Chinese.
-
The role of spatial interplay patterns between PD-L1-positive tumor cell and T cell in recurrence of locally advanced non-small cell lung cancer.Cancer Immunol Immunother. 2023 Jul;72(7):2015-2027. doi: 10.1007/s00262-023-03380-z. Epub 2023 Feb 4. Cancer Immunol Immunother. 2023. PMID: 36738309 Free PMC article.
-
Closer proximity of pre-treatment CD4+ T cells to CD8+ T cells favor response to neoadjuvant immunotherapy in patients with PD-L1 low-expressing non-small cell lung cancer.Transl Lung Cancer Res. 2025 Mar 31;14(3):810-823. doi: 10.21037/tlcr-24-886. Epub 2025 Mar 26. Transl Lung Cancer Res. 2025. PMID: 40248717 Free PMC article.
-
Dysfunction of CD8+ T cells around tumor cells leads to occult lymph node metastasis in NSCLC patients.Cancer Sci. 2024 Aug;115(8):2528-2539. doi: 10.1111/cas.16206. Epub 2024 May 8. Cancer Sci. 2024. PMID: 38720474 Free PMC article.
Cited by
-
Analyzing the Spatial Distribution of Immune Cells in Lung Adenocarcinoma.J Pers Med. 2024 Aug 30;14(9):925. doi: 10.3390/jpm14090925. J Pers Med. 2024. PMID: 39338178 Free PMC article.
-
Image-based multiplex immune profiling of cancer tissues: translational implications. A report of the International Immuno-oncology Biomarker Working Group on Breast Cancer.J Pathol. 2024 Mar;262(3):271-288. doi: 10.1002/path.6238. Epub 2024 Jan 17. J Pathol. 2024. PMID: 38230434 Free PMC article. Review.
-
A novel identified epithelial ligand-receptor-associated gene signature highlights POPDC3 as a potential therapy target for non-small cell lung cancer.Cell Death Dis. 2025 Feb 19;16(1):114. doi: 10.1038/s41419-025-07410-9. Cell Death Dis. 2025. PMID: 39971925 Free PMC article.
-
High PD-L1 Expression Correlates with an Immunosuppressive Tumour Immune Microenvironment and Worse Prognosis in ALK-Rearranged Non-Small Cell Lung Cancer.Biomolecules. 2023 Jun 15;13(6):991. doi: 10.3390/biom13060991. Biomolecules. 2023. PMID: 37371571 Free PMC article.
-
MET Exon 14 Skipping Mutations in Lung Cancer: Clinical-Pathological Characteristics and Immune Microenvironment.Curr Oncol. 2025 Jul 14;32(7):403. doi: 10.3390/curroncol32070403. Curr Oncol. 2025. PMID: 40710213 Free PMC article.
References
Publication types
MeSH terms
LinkOut - more resources
Full Text Sources
Medical
Research Materials