

Using two-step cluster analysis to classify inpatients with primary biliary cholangitis based on autoantibodies: A real-world retrospective study of 537 patients in China
- PMID: 36685575
- PMCID: PMC9845730
- DOI: 10.3389/fimmu.2022.1098076
Using two-step cluster analysis to classify inpatients with primary biliary cholangitis based on autoantibodies: A real-world retrospective study of 537 patients in China
Abstract
Background: A variety of autoantibodies have been detected in primary biliary cholangitis (PBC), while the presence of autoantibody clusters and their clinical significance have not been fully understood. We aimed at defining autoantibody clusters and to better understand the clinical features and prognosis of PBC patients based on autoantibody clusters under real-world conditions.
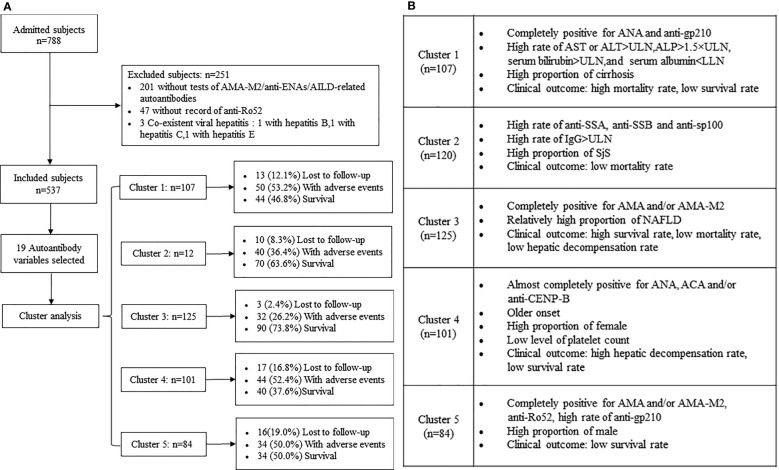
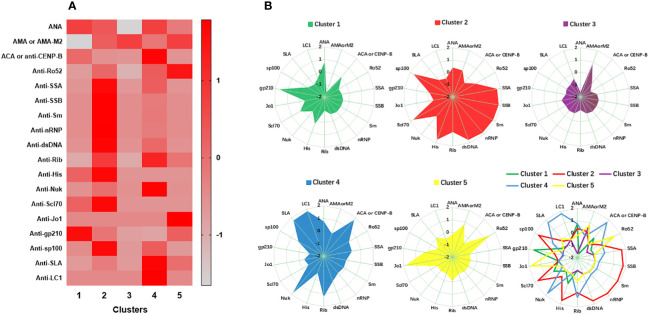
Methods: We retrospectively analyzed 788 inpatients with PBC evaluated between October 2008 and July 2019, and included 537 patients. Nineteen autoantibodies which were measured routinely were investigated for cluster analysis. Two-step clustering, Kaplan-Meier survival, and Cox regression analyses were used.
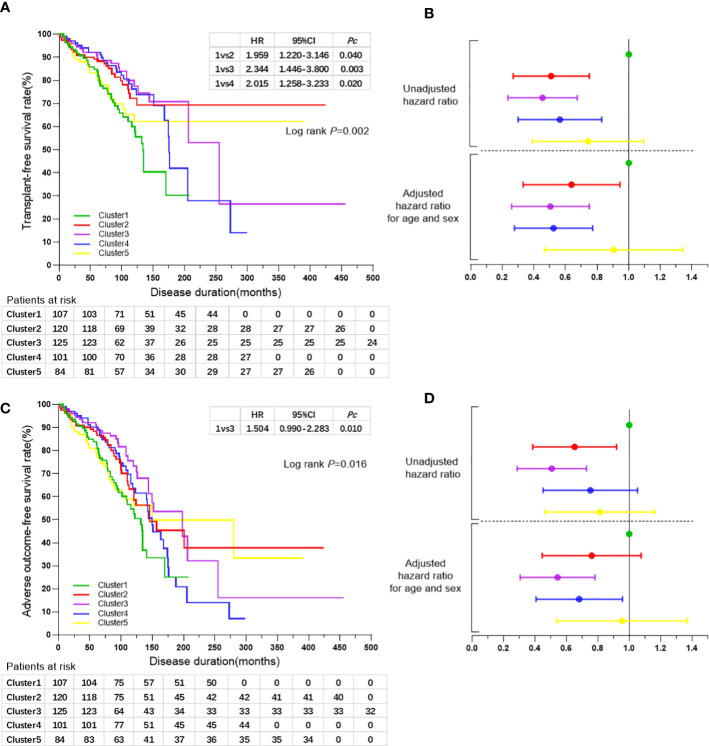
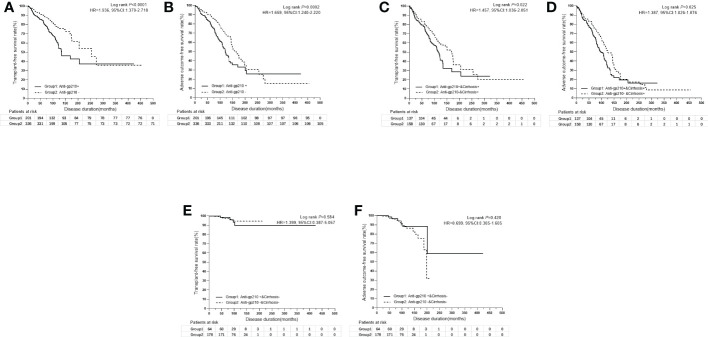
Results: Five clusters were defined. A cluster of antinuclear antibodies (ANA) and anti-gp210 positive patients were identified with a high rate of cirrhosis at baseline and low survival rate; a cluster of ANA, anti-centromere antibodies (ACA) and/or anti-CENP-B female dominant patients with older disease onset, low level of platelet count at baseline, high rate of hepatic decompensation, and low survival rate was also characterized; and another cluster of anti-mitochondrial antibodies (AMA) and/or AMA-M2, anti-Ro52 and a high rate of anti-gp210 positive patients were identified with a high proportion of male patients and low survival rate. A subgroup of patients with anti-SSA and/or anti-SSB coexists with SjS was also identified; patients with only AMA and/or AMA-M2-positive with a benign clinical outcome and relatively high complication of non-alcoholic fatty liver disease (NAFLD) were also identified. Only anti-gp210 was considered as a significant predictor for poor outcomes especially in patients with cirrhosis.
Conclusion: Clustering methods allow the identification of distinct autoantibody profiles of PBC that form clinical subsets and can be useful for personalized approaches to diagnosis, clinical management, and the prediction of clinical outcomes. Anti-gp210 was the strongest predictive factor for poor outcomes especially in PBC patients with cirrhosis under real-world conditions.
Keywords: autoantibody; primary biliary cholangitis; real-world study; retrospective study; two-step cluster analysis.
Copyright © 2023 Zhao, Yan, Liao, Liu, Han, Zhang, Zhang, Huang, Liu, Lou and Zhao.
Conflict of interest statement
The authors declare that the research was conducted in the absence of any commercial or financial relationships that could be construed as a potential conflict of interest.
Figures
Similar articles
-
Autoantibodies in Chinese patients with chronic hepatitis B: prevalence and clinical associations.World J Gastroenterol. 2015 Jan 7;21(1):283-91. doi: 10.3748/wjg.v21.i1.283. World J Gastroenterol. 2015. PMID: 25574103 Free PMC article.
-
Clinical performance of AMA-M2, anti-gp210 and anti-sp100 antibody levels in primary biliary cholangitis: When detected by multiplex bead-based flow fluorescent immunoassay.Immun Inflamm Dis. 2024 Jan;12(1):e1161. doi: 10.1002/iid3.1161. Immun Inflamm Dis. 2024. PMID: 38270327 Free PMC article.
-
Prevalence of primary biliary cirrhosis in adults referring hospital for annual health check-up in Southern China.BMC Gastroenterol. 2010 Sep 3;10:100. doi: 10.1186/1471-230X-10-100. BMC Gastroenterol. 2010. PMID: 20815889 Free PMC article.
-
[How to understand the clinical significance of autoantibodies in primary biliary cholangitis].Zhonghua Gan Zang Bing Za Zhi. 2017 Nov 20;25(11):810-815. doi: 10.3760/cma.j.issn.1007-3418.2017.11.003. Zhonghua Gan Zang Bing Za Zhi. 2017. PMID: 29325273 Review. Chinese.
-
Autoimmune Markers in Primary Biliary Cholangitis.Clin Liver Dis. 2024 Feb;28(1):93-101. doi: 10.1016/j.cld.2023.07.002. Epub 2023 Aug 17. Clin Liver Dis. 2024. PMID: 37945165 Review.
Cited by
-
Activated Immune and Complement C3 Are Potential Contributors in MASH via Stimulating Neutrophil Extracellular Traps.Cells. 2025 May 19;14(10):740. doi: 10.3390/cells14100740. Cells. 2025. PMID: 40422243 Free PMC article.
-
Prevalence and prognostic significance of main metabolic risk factors in primary biliary cholangitis: a retrospective cohort study of 789 patients.Front Endocrinol (Lausanne). 2023 Nov 8;14:1142177. doi: 10.3389/fendo.2023.1142177. eCollection 2023. Front Endocrinol (Lausanne). 2023. PMID: 38027142 Free PMC article.
-
Risk Stratification in Primary Biliary Cholangitis.J Clin Med. 2023 Sep 1;12(17):5713. doi: 10.3390/jcm12175713. J Clin Med. 2023. PMID: 37685780 Free PMC article. Review.
References
Publication types
MeSH terms
Substances
LinkOut - more resources
Full Text Sources
Research Materials