. 2023 Jan 4:13:1026185.
doi: 10.3389/fimmu.2022.1026185. eCollection 2022.

Deep dive into the immune response against murine mesothelioma permits design of novel anti-mesothelioma therapeutics

Affiliations

Deep dive into the immune response against murine mesothelioma permits design of novel anti-mesothelioma therapeutics

Esther Stern et al. Front Immunol. .

Abstract

Given the need to improve the efficacy of standard-of-care immunotherapy (anti-CTLA-4 + anti-PD-1) in human malignant pleural mesothelioma (hMPM), we thoroughly characterized the immunobiology of the AB12 murine mesothelioma (MM) model, aiming to increase its accuracy in predicting the response of hMPM to immunotherapy and in designing novel anti-hMPM treatments. Specifically, we used immunologic, transcriptomic and survival analyses, to synchronize the MM tumor growth phases and immune evolution with the histo-molecular and immunological characteristics of hMPM while also determining the anti-MM efficacy of standard-of-care anti-hMPM immunotherapy as a benchmark that novel therapeutics should meet. We report that early-, intermediate- and advanced- AB12 tumors are characterized by a bell-shaped anti-tumor response that peaks in intermediate tumors and decays in advanced tumors. We further show that intermediate- and advanced- tumors match with immune active ("hot") and immune inactive ("cold") hMPM respectively, and that they respond to immunotherapy in a manner that corresponds well with its performance in real-life settings. Finally, we show that in advanced tumors, addition of cisplatin to anti CTLA-4 + anti PD-1 can extend mice survival and invigorate the decaying anti-tumor response. Therefore, we highlight this triple combination as a worthy candidate to improve clinical outcomes in hMPM.

Keywords: animal models; immunomodulation; immunotherapy; lung neoplasms; thoracic cancer.


Conflict of interest statement

The authors declare that the research was conducted in the absence of any commercial or financial relationships that could be construed as a potential conflict of interest.

Figures

Figure 1
Figure 1
AB12 tumors characterization. (A) Kaplan-Meier survival curve of mice injected with AB12 cells. n=28. Cum: cumulative. (B) Histological features of early, intermediate and advanced phase AB12 tumors. Representative hematoxylin and eosin staining of tumors. Original magnification X10. (C) Evaluation of the necrosis area in AB12 tumors. The percentage of necrotic area out of the entire tumor area in d6, d10 and d14 tumors is shown. Values of the post hoc Tukey test are indicated at the top of the dot plots. **: p ≤ 0.01; ***: p ≤ 0.001. (D) Schematic axis of tumor development. (E) Integration based on transcriptomic data of AB12 tumors in hMPM tumors. Unsupervised clustering of d6, d10 and d14 AB12 tumors with 295 hMPM tumor samples was performed based on transcriptomic data obtained by RNA-Seq. The series of each tumor sample, the histologic and molecular subtypes, the histo-molecular gradients (E.score and S.score) and the collect timepoint of AB12 tumors are indicated by a color code or a color gradient at the top of the heatmap. Clusters C1 to C3 are indicated at the top as well as the deduced histologic subtypes at the bottom.
Figure 2
Figure 2
Tumor microenvironment in d6, d10 and d14 AB12 tumors. (A) Dysregulated signal pathways between tumors identified by over-representation analysis. The families and sub-families of the major over-represented signal pathways are shown in the figure for each comparison indicated at the top of the figure. Over-representation of each pathway, based on underexpressed and overexpressed genes, in blue and brown, respectively, is indicated as a circle, whose size is proportional to the gene ratio and the color gradient represents the FDR p-values. (B) Differential infiltration of immune and stromal cell populations between tumors. In the upper part, the fold-changes (FC) in mMCP-counter scores of each cell population are represented as a heatmap. The collect timepoints and the names of the AB12 tumor samples are indicated above and below the heatmap, respectively. The significant p-values of the ANOVA test are indicated at the left of the heatmap if the FC is higher than 2 in d10 or d14 compared to d6. In the lower part, the dot plots show the FC of T cell and CD8 T cell populations. The FC are relative to the mean scores obtained in d6 tumors. (C) T cell infiltration of AB12 tumors identified by flow cytometry. Single cell tumor suspensions, stained with anti CD45, anti CD3 and anti CD8 antibodies, were analyzed using flow cytometry. Representative FACS dot plots show the percentage of CD3+, CD8+ and CD3+ CD8-, corresponding to CD3+ CD4+ cells, out of CD45+ cells in the tumors. On the right, the bars show the average percentage of CD3+ PD8+ cells out of CD45+ cells in the tumors (n=3 per time point). (D) Differential expression of T cells cytolytic and activation genes between d6, d10 and d14 AB12 tumors. The dot plots show the FC relative to the mean of the d6 tumor gene expressions of Prf1 (perforin-1), Gzmb (granzyme B) and Pdcd1 (PD-1) genes, based on RNA-Seq data. (E) PD-1 expression on tumor infiltrating CD8 T cells identified by flow cytometry. Single cell tumor suspensions, stained with anti CD45, anti CD3, anti CD8 and anti PD-1 antibodies, were analyzed by flow cytometry. Representative FACS dot plots show the percentage of CD8+ PD-1+ cells out of CD3+ cells in the tumors. On the right, the bars show the average percentage of CD8+ PD-1+ cells out of CD3+ cells in the tumors (n=3 per time point). The p-values of the post hoc Tukey test are indicated at the top of the dot plots and of the histogram (B, D and E). FC: Fold-Change. *p ≤ 0.05; **p ≤ 0.01; ***p ≤ 0.001; ****p ≤ 0.0001.
Figure 3
Figure 3
Immune response at remote immune sites. (A, B). Changes in the immune content of the spleen and peripheral blood (PB) of tumor bearing mice between d6, d10, d14 and d20. The numbers, determined by flow cytometry, of CD8 and CD4 T cells, NK cells, neutrophils, F4/80 positive monocytes and B cells out of 10,000 CD45+ cells in the spleen (A) or peripheral blood (B) of tumor bearing mice are shown (n≥6). The CD8/CD4 ratio at both sites is shown as well (C) Tumor phase dependent expression in the spleen of genes that mark the anti-tumor response in the TME. The changes relative to d6 tumor mean expression of the IFNa, IFNb1, IFNg, Cxcl9 and Cxcl10 genes in the spleen of tumor bearing mice between d6, d10, d14 and d20 are shown (n=4). (D) Tumor phase dependent expression of cytolytic and activation genes in the spleen. The changes relative to d6 tumor mean expression of the Prf1, Gzmb and Pdcd1 genes in the spleen of tumor bearing mice between d6, d10, d14 and d20 are shown (n=4). (E) Responsiveness of splenocytes derived from tumor bearing mice to AB12 cells in vitro. AB12 cells were co-cultured with splenocytes derived either from d6, d12 and d20 tumor bearing mice or from naïve mice and 24 hours later, the levels of IFNg protein in the medium were measured by ELISA (n=3). The p-values of the post hoc Tukey test are indicated at the top of the dot plots and the histogram (A to E). *p ≤ 0.05; **p ≤ 0.01; ***p ≤ 0.001; ****p ≤ 0.0001.
Figure 4
Figure 4
Response to anti CTLA-4 immune checkpoint inhibitor. (A) Dysregulated signal pathways in anti CTLA-4 treated AB12 tumors identified by over-representation analysis. Signal pathways representation in AB12 tumors either treated on d6/d10 with anti-CTLA4 (early treatment) or untreated and collected on d14 has been compared. The families and sub-families of the major over-represented signal pathways are shown in the figure. Over-representation of each pathway, based on underexpressed and overexpressed genes, in blue and brown, respectively, is indicated as a circle, whose size is proportional to the gene ratio and the color gradient represents the FDR p-values. (B) Differential infiltration of immune and stromal cell populations. In the upper part, the fold-changes (FC) in mMCP-counter scores of each cell population are represented as a heatmap. The collect timepoints and the treatment, and the names of the tumor samples are indicated above and below the heatmap, respectively. The significant p-values of the ANOVA test, comparing untreated and anti CTLA-4 treated tumors, are indicated at the left of the heatmap if the FC is higher than 2. In the lower part, the dot plots show the FC for T cell and CD8 T cell populations. The FC are relative to the mean scores obtained in untreated AB12 tumors and collected on d=10. (C) Gene expression of cytolytic and activation genes. The dot plots show the FC relative to the mean of d10 tumors of Prf1 (perforin-1), Gzmb (granzyme B) and Pdcd1 (PD-1) gene expression, based on RNA-Seq data, between anti CTLA-4 treated and untreated tumors. (D) Immune content of the spleen and peripheral blood (PB). The numbers, determined by flow cytometry, of CD8 and CD4 T cells, neutrophils and F4/80 positive monocytes out of 10,000 CD45+ cells in the spleen and PB of either untreated d10 and d14 tumor-bearing mice or anti CTLA-4 treated d14 tumor-bearing mice are shown (n>6). The CD8/CD4 ratio at both sites is shown as well. (E) Expression of T cells cytolytic and activation genes in the spleen. The relative change in mean expression of the Prf1, Gzmb and Pdcd1 genes in the spleens either untreated d10 and d14 tumor-bearing mice or anti CTLA-4 treated d14 tumor-bearing mice are shown (n=3). (F) Responsiveness of splenocytes derived from anti CTLA-4 treated mice to AB12 cells in vitro. Tumor-bearing mice were either treated early (on d6/d10) or late (on d14/d18) with two injections of anti CTLA-4 and splenocytes were derived from these mice on d12 and d20, respectively, as well as splenocytes from untreated mice. The levels of IFNg protein secreted in the medium were measured by ELISA in splenocytes co-cultured with AB12 cells (n≥4). The p-values of the post hoc Tukey test and of the unpaired T test are indicated at the top of the dot plots (B to E) and at the top of the histogram (F), respectively. FC: Fold-Change. *p ≤ 0.05; **p ≤ 0.01; ***p ≤ 0.001; ****p ≤ 0.0001.
Figure 5
Figure 5
Immune features of AB12 tumors in comparison to hMPM. (A) Integration based on immune and stromal cells infiltrations of AB12 tumors in hMPM tumors. Unsupervised clustering of untreated and anti CTLA-4 treated AB12 tumors with 295 hMPM tumor samples was performed based on the infiltrations of immune and stromal cell populations. The series of each tumor sample, the collect timepoint and the treatment of AB12 tumors are indicated by a color code at the top of the heatmap. At the bottom of the heatmap, clusters were divided into tumors with a “hot” and “cold” immune profiles based on immune cells infiltration. (B) Thorsson immune classification. Thorsson immune subtypes (TIS) were determined in the 295 hMPM and in AB12 tumor samples using TIS transcriptomic signatures. Tumor samples were classified in one of the TIS based on the highest signature score. The pie chart shows the distribution of the 6 TIS in hMPM tumor samples. AB12 tumors were all classified as TIS2.
Figure 6
Figure 6
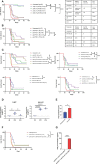
Anti MPM immunotherapy in AB12 tumor model. A-B. Tumor phase dependent efficacy of single agent immunotherapy. The Kaplan-Meier survival curves show the response of AB12 tumors to treatment with either anti CTLA-4 (A) or anti PD-1 (B) when initiated on d3, d6, d9 or d12. The tables show the median survival, the half-life extension period and the cure rates for each treatment and time point. (C) Differential expression Havcr2 and Lag3 genes between d6, d10 and d14 AB12 tumors. The dot plots show the fold-changes (FC) of gene expression relative to the mean of d6 tumors of Havcr2 (TIM-3) and Lag3 (LAG-3) genes, based on RNA-Seq data. The p-values of the post hoc Tukey test are indicated at the top of the dot plots. (D) Responsiveness of splenocytes to cisplatin treated AB12 cells in vitro. AB12 cells were either treated or not with cisplatin. The levels of IFNg protein in the medium were measured by ELISA in tumor cells co-cultured with splenocytes. (n=3). (E) Efficacy of combination immunotherapy against AB12 tumors. The Kaplan-Meier survival curves show the response of AB12 tumors to treatment with several combinations of immunotherapy. The responses to anti CTLA-4 + anti PD-1 initiated on d9, or d12 or d14 (upper left), anti CTLA-4 + anti LAG-3 initiated on d9 (upper right), anti CTLA-4 + anti TIM-3 initiated on d9 (lower left), anti CTLA-4 + cisplatin initiated on d9 (lower right) are shown. (F) Efficacy of anti CTLA-4 + anti PD-1 + cisplatin against advanced AB12 tumors. The Kaplan-Meier survival curves show the response of AB12 tumors to treatment with either anti CTLA-4 + anti PD-1 or anti CTLA-4 + anti PD-1 + cisplatin initiated on d14. (G) Responsiveness of splenocytes derived from anti CTLA-4 + anti PD-1 + cisplatin treated mice to AB12 cells in vitro. Splenocytes were derived on d20 from tumor-bearing mice that were treated on d14 with either anti CTLA-4 + PD-1 or anti CTLA-4 + PD-1 + cisplatin. The levels of IFNg protein were measured by ELISA in the medium of tumor cells co-cultured with splenocytes. (n=3). The p-values of the unpaired T test are indicated at the top of the histogram (D, G). The differences between survival curves were calculated by the log-rank test (A, B, E, F). FC: Fold-Change; cis: cisplatin. *p ≤ 0.05; **p ≤ 0.01; ***p ≤ 0.001; ****p ≤ 0.0001.

References

    1. Baas P, Scherpereel A, Nowak AK, Fujimoto N, Peters S, Tsao AS, et al. . First-line nivolumab plus ipilimumab in unresectable malignant pleural mesothelioma (CheckMate 743): a multicentre, randomised, open-label, phase 3 trial. Lancet (2021) 397(10272):375–86. doi: 10.1016/S0140-6736(20)32714-8 - DOI - PubMed
    1. Scherpereel A, Mazieres J, Greillier L, Lantuejoul S, Dô P, Bylicki O, et al. . Nivolumab or nivolumab plus ipilimumab in patients with relapsed malignant pleural mesothelioma (IFCT-1501 MAPS2): a multicentre, open-label, randomised, non-comparative, phase 2 trial. Lancet Oncol (2019) 20(2):239–53. doi: 10.1016/S1470-2045(18)30765-4 - DOI - PubMed
    1. Aldea M, Benitez JC, Chaput N, Besse B. New immunotherapy combinations enter the battlefield of malignant mesothelioma. Cancer Discovery (2021) 11(11):2674–6. doi: 10.1158/2159-8290.CD-21-1046 - DOI - PubMed
    1. Mezzapelle R, Rrapaj E, Gatti E, Ceriotti C, Marchis FD, Preti A, et al. . Human malignant mesothelioma is recapitulated in immunocompetent BALB/c mice injected with murine AB cells. Sci Rep (2016) 6:22850. doi: 10.1038/srep22850 - DOI - PMC - PubMed
    1. Robinson BW, Redwood AJ, Creaney J. How our continuing studies of the pre-clinical inbred mouse models of mesothelioma have influenced the development of new therapies. Front Pharmacol (2022) 13:858557. doi: 10.3389/fphar.2022.858557 - DOI - PMC - PubMed

Publication types