

Transcutaneous Electrical Stimulation for the Prevention of Dry Eye Disease after Photorefractive Keratectomy: Randomized Controlled Trial
- PMID: 36685712
- PMCID: PMC9853365
- DOI: 10.1016/j.xops.2022.100242
Transcutaneous Electrical Stimulation for the Prevention of Dry Eye Disease after Photorefractive Keratectomy: Randomized Controlled Trial
Abstract
Objective: To evaluate the efficacy and safety of transcutaneous electrical stimulation (TES) for the prevention of dry eye after photorefractive keratectomy (PRK).
Design: Prospective, single-center, single-blinded, parallel group, placebo-controlled, randomized clinical trial.
Participants: Between February 2020 and October 2020, patients at the Samsung Medical Center scheduled to undergo PRK to correct myopia were screened and enrolled.
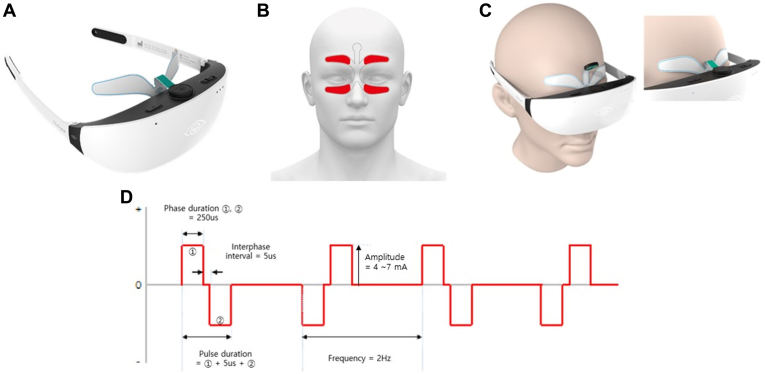
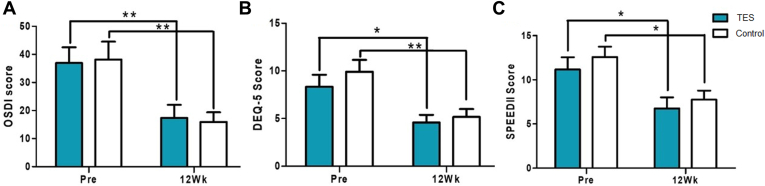
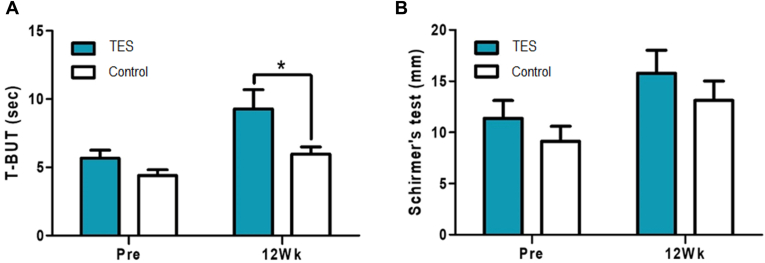
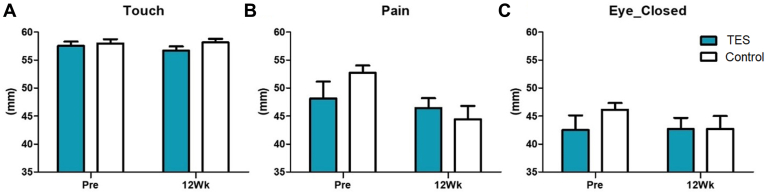
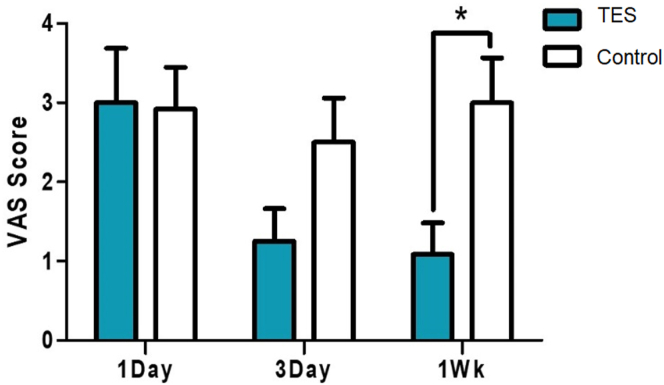
Methods: The participants in the TES group were instructed to use the electrical stimulation device (Nu Eyne 01, Nu Eyne Co) at the periocular region after the operation, whereas those in the control group were to use the sham device. Dry eye symptoms were evaluated preoperatively and postoperatively at weeks 1, 4, and 12 using the Ocular Surface Disease Index (OSDI) questionnaire, the 5-Item Dry Eye Questionnaire (DEQ-5), and the Standard Patient Evaluation for Eye Dryness II (SPEED II) questionnaire. Dry eye signs were assessed using tear break-up time (TBUT), total corneal fluorescein staining (tCFS), and total conjunctival staining score according to the National Eye Institute/Industry scale. The pain intensity was evaluated using a visual analog scale.
Main outcome measures: Primary outcomes were OSDI and TBUT.
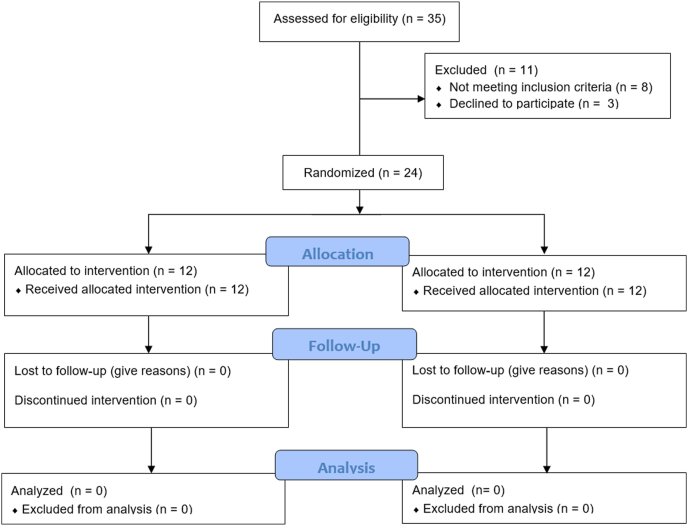
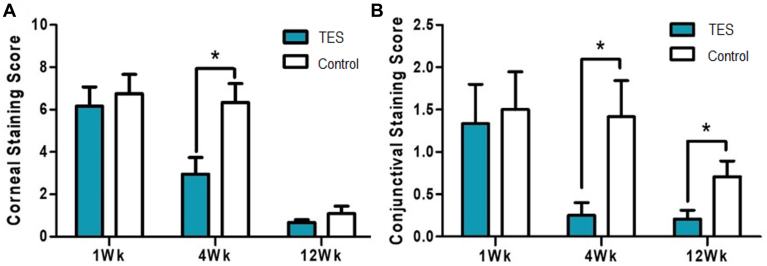
Results: Twenty-four patients were enrolled and completed follow-up until the end of the study (12 patients in the TES group, 12 patients in the control group). Refractive outcomes and visual acuity were not different between the groups. No serious adverse event was reported with regard to device use. No significant difference in OSDI and SPEED II questionnaires and the DEQ-5 was observed between the groups in the 12th week after surgery. The TBUT scores 12 weeks after the surgery were 9.28 ± 6.90 seconds in the TES group and 5.98 ± 2.55 seconds in the control group with significant difference (P = 0.042). The tCFS and total conjunctival staining score were significantly lower in the TES group than in the control group at postoperative 4 weeks. Pain intensity at the first week was significantly lower in the TES group than in the control group by 65% (P = 0.011).
Conclusion: The application of TES is safe and effective in improving dry eye disease after PRK.
Financial disclosures: The author(s) have no proprietary or commercial interest in any materials discussed in this article.
Keywords: Corneal nerve regeneration; DED, dry eye disease; DEQ-5, 5-Item Dry Eye Questionnaire; Dry eye; Electrostimulation; LLT, lipid layer thickness; NGF, nerve growth factor; OSDI, Ocular Surface Disease Index; PRK, photorefractive keratectomy; Refractive surgery; SPEED II, Standard Patient Evaluation for Eye Dryness II; TBUT, tear break-up time; TES, transcutaneous electrical stimulation; UDVA, uncorrected distant visual acuity; tCFS, total corneal fluorescein staining.
© 2022 by the American Academy of Ophthalmology. Published by Elsevier Inc.
Figures
Similar articles
-
Age Associations with Dry Eye Clinical Signs and Symptoms in the Dry Eye Assessment and Management (DREAM) Study.Ophthalmol Sci. 2023 Jan 12;3(2):100270. doi: 10.1016/j.xops.2023.100270. eCollection 2023 Jun. Ophthalmol Sci. 2023. PMID: 36846104 Free PMC article.
-
Magnitude and Predictors of the Placebo Effects in the Dry Eye Assessment and Management Study.Ophthalmol Sci. 2025 Feb 5;5(3):100730. doi: 10.1016/j.xops.2025.100730. eCollection 2025 May-Jun. Ophthalmol Sci. 2025. PMID: 40144460 Free PMC article.
-
Chronic dry eye in photorefractive keratectomy and laser in situ keratomileusis: Manifestations, incidence, and predictive factors.J Cataract Refract Surg. 2015 Dec;41(12):2624-34. doi: 10.1016/j.jcrs.2015.06.037. J Cataract Refract Surg. 2015. PMID: 26796443 Free PMC article.
-
Intense pulsed light (IPL) therapy for the treatment of meibomian gland dysfunction.Cochrane Database Syst Rev. 2020 Mar 18;3(3):CD013559. doi: 10.1002/14651858.CD013559. Cochrane Database Syst Rev. 2020. PMID: 32182637 Free PMC article.
-
Wavefront excimer laser refractive surgery for adults with refractive errors.Cochrane Database Syst Rev. 2020 Dec 18;12(12):CD012687. doi: 10.1002/14651858.CD012687.pub2. Cochrane Database Syst Rev. 2020. PMID: 33336797 Free PMC article.
Cited by
-
Quantum molecular resonance electrotherapy (Rexon-Eye) for recalcitrant dry eye in an Asian population.Front Med (Lausanne). 2023 Sep 12;10:1209886. doi: 10.3389/fmed.2023.1209886. eCollection 2023. Front Med (Lausanne). 2023. PMID: 37771976 Free PMC article.
-
Randomized, double-masked, sham-controlled trial of efficacy and safety of quantum molecular resonance for treating meibomian gland dysfunction.Eye (Lond). 2025 Aug;39(12):2451-2459. doi: 10.1038/s41433-025-03890-3. Epub 2025 Jun 27. Eye (Lond). 2025. PMID: 40579435 Free PMC article. Clinical Trial.
-
Dry Eye Disease Management Via Technological Methods: A Systematic Review and Network Meta-analysis.Ophthalmol Ther. 2025 Aug;14(8):1917-1954. doi: 10.1007/s40123-025-01187-y. Epub 2025 Jul 2. Ophthalmol Ther. 2025. PMID: 40601205 Free PMC article.
References
LinkOut - more resources
Full Text Sources
Research Materials
