. 2022 Nov 13;3(2):100257.
doi: 10.1016/j.xops.2022.100257. eCollection 2023 Jun.

Acoustic Micro-Tapping Optical Coherence Elastography to Quantify Corneal Collagen Cross-Linking: An Ex Vivo Human Study

Affiliations

Acoustic Micro-Tapping Optical Coherence Elastography to Quantify Corneal Collagen Cross-Linking: An Ex Vivo Human Study

Mitchell A Kirby et al. Ophthalmol Sci. .

Abstract

Purpose: To evaluate changes in the anisotropic elastic properties of ex vivo human cornea treated with ultraviolet cross-linking (CXL) using noncontact acoustic micro-tapping optical coherence elastography (AμT-OCE).

Design: Acoustic micro-tapping OCE was performed on normal and CXL human donor cornea in an ex vivo laboratory study.

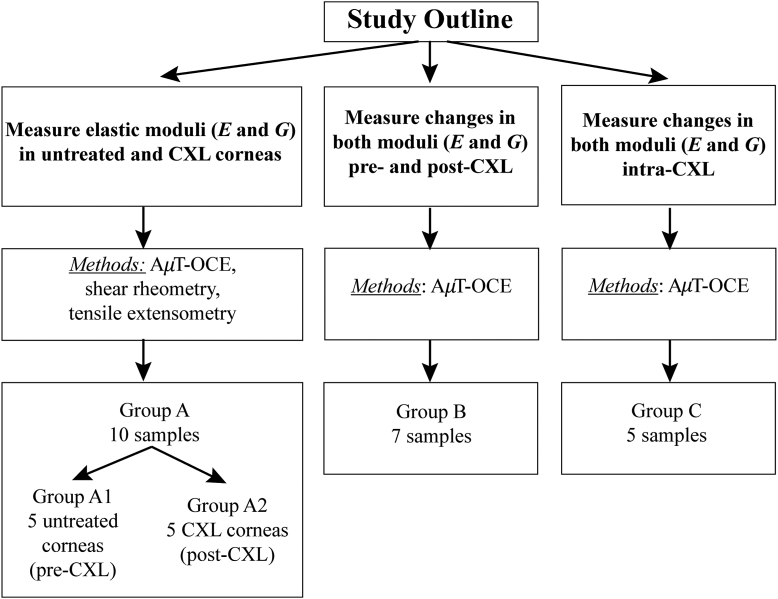
Subjects: Normal human donor cornea (n = 22) divided into 4 subgroups. All samples were stored in optisol.

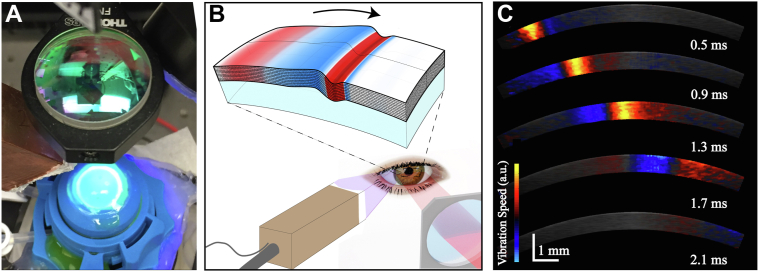
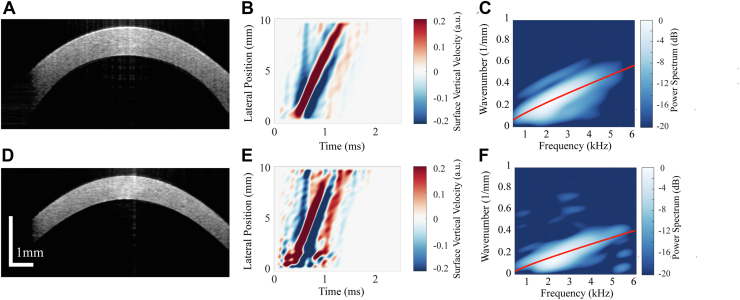
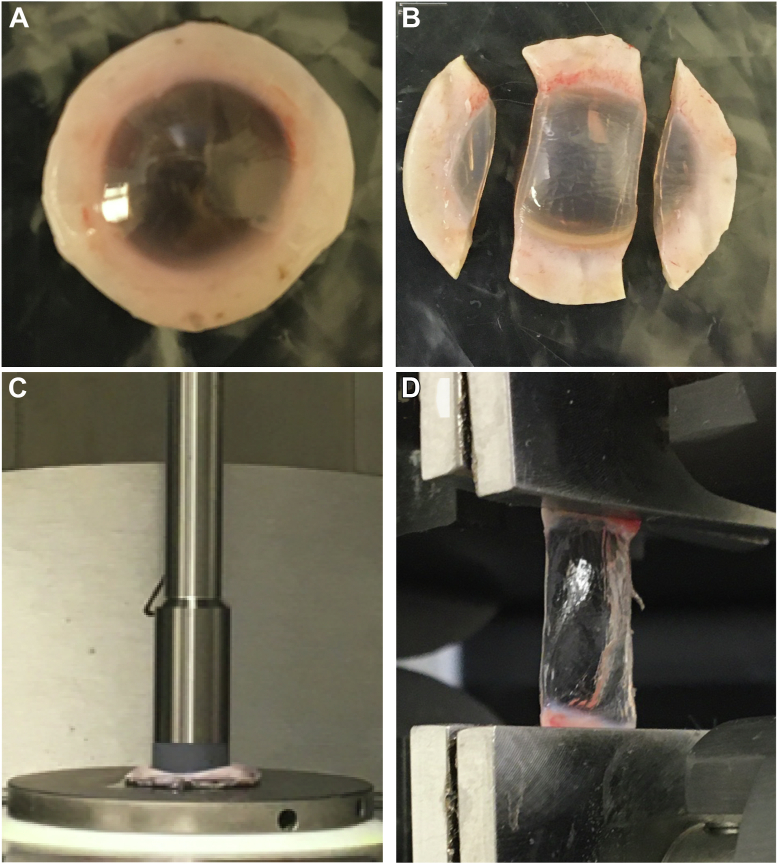
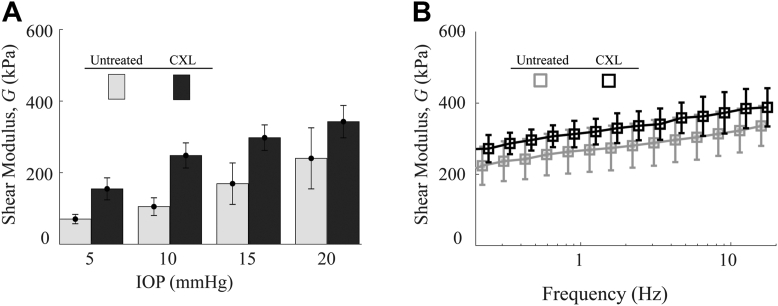
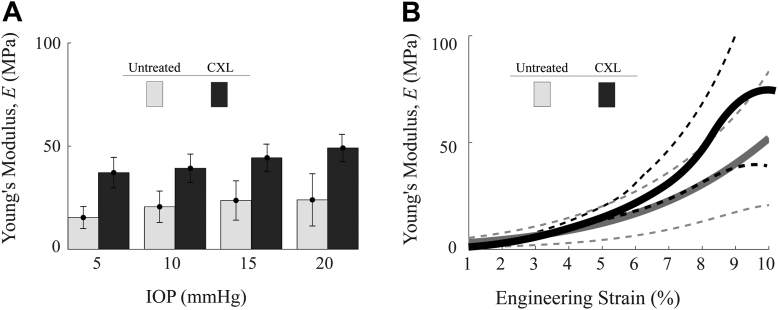
Methods: Elastic properties (in-plane Young's, E, and out-of-plane, G, shear modulus) of normal and ultraviolet CXL-treated human corneas were quantified using noncontact AμT-OCE. A nearly incompressible transverse isotropic model was used to reconstruct moduli from AμT-OCE data. Independently, cornea elastic moduli were also measured with destructive mechanical tests (tensile extensometry and shear rheometry).

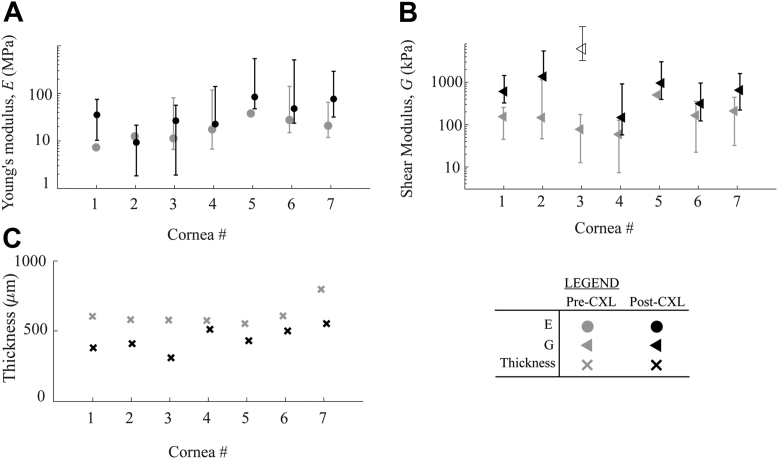
Main outcome measures: Corneal elastic moduli (in-plane Young's modulus, E, in-plane, μ, and out-of-plane, G, shear moduli) can be evaluated in both normal and CXL treated tissues, as well as monitored during the CXL procedure using noncontact AμT-OCE.

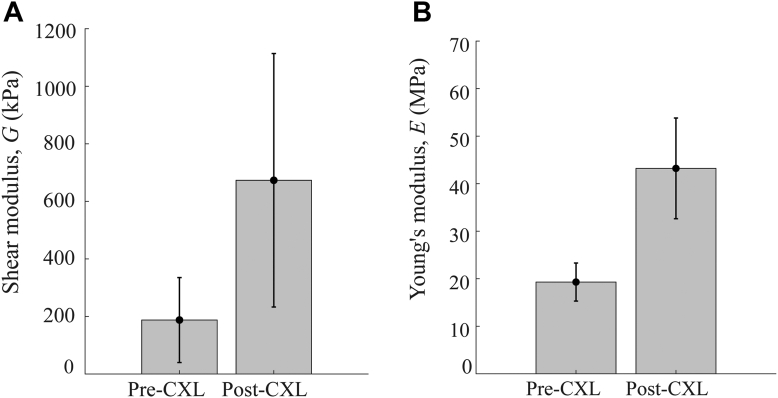
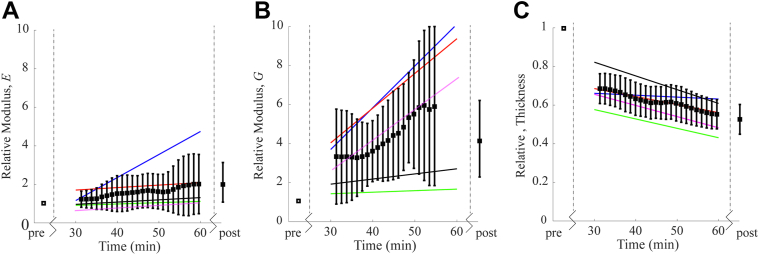
Results: Cross-linking induced a significant increase in both in-plane and out-of-plane elastic moduli in human cornea. The statistical mean in the paired study (presurgery and postsurgery, n = 7) of the in-plane Young's modulus, E = 3 μ , increased from 19 MPa to 43 MPa, while the out-of-plane shear modulus, G, increased from 188 kPa to 673 kPa. Mechanical tests in a separate subgroup support CXL-induced cornea moduli changes and generally agree with noncontact AμT-OCE measurements.

Conclusions: The human cornea is a highly anisotropic material where in-plane mechanical properties are very different from those out-of-plane. Noncontact AμT-OCE can measure changes in the anisotropic elastic properties in human cornea as a result of ultraviolet CXL.

Keywords: AμT, acoustic micro-tapping; BSS, balanced saline solution; CXL, cross-linking; Cornea; Cross-linking; Elastic Anisotropy; IOP, intraocular pressure; NITI model; NITI, nearly incompressible transverse isotropy; OCE, optical coherence elastography; Optical Coherence Elastography; RF, riboflavin; UV, ultraviolet.


Figures

Figure 1
Figure 1
Schematic of the 3 different experiments performed and the corresponding number of samples in each group. AμT = acoustic micro-tapping; CXL = cross–linking; OCE = optical coherence elastography.
Figure 2
Figure 2
(A) Acoustic micro-tapping optical coherence elastography imaging system with cornea inflated via artificial anterior chamber undergoing cross-linking treatment. (B) Schematic of mechanical wave propagation within the cornea. (C) Snapshots of elastic transients detected at different time instants using phase-sensitive OCT.
Figure 3
Figure 3
Central cornea cross-section and automatic segmentation to determine the surface location and thickness (A) pre-cross-linking (CXL) and (D) post-CXL. Wave fields of propagating guided waves in the same cornea (B) pre-CXL and (E) post-CXL tracked over ∼8.5 mm of corneal tissue. Best-fit solution to the dispersion equation (based on a unique combination of elastic moduli, E and G, displayed in red) on top of the measured waveform in the two-dimensional Fourier spectrum for the corresponding cornea (C) pre- and (F) post-CXL.
Figure 4
Figure 4
(A) Cornea buttons prepared and (C) loaded in parallel-plate rheometry to measure out-of-plane shear modulus, G. (B) Cornea strips prepared and (D) clamped during extension testing to determine in-plane Young’s modulus, E.
Figure 5
Figure 5
(A) Out-of-plane shear modulus, G, in untreated (A1) and cross-linkng (CXL) (A2) cornea groups measured with acoustic micro-tapping optical coherence elastography at intraocular pressures (IOPs) from 5–20 mmHg, respectively. (B) Shear storage modulus, G, measured with parallel plate rheometry for untreated (A1) and CXL (A2) cornea groups.
Figure 6
Figure 6
(A) In-plane Young’s modulus, E, in untreated group (A1) and cross-linking (CXL) group (A2) measured with coustic micro-tapping optical coherence elastography at intraocular pressures (IOPs) from 5–20 mmHg. (B) Strain-dependent Young’s moduli measured via extension testing up to 10% strain in untreated group (A1) and CXL group (A2). E was determined via extension testing to 10% strain, or where visible tissue damage occurred. The dashed lines correspond with ± 1 standard deviation. Individual tests can be found in the Supplemental Methods.
Figure 7
Figure 7
Cross-linking (CXL)-induced differences in (A) in-plane Young’s modulus, E, and (B) out-of-plane shear modulus, G, for cornea in group B. Error bars correspond with uncertainty intervals described in the Supplemental Methods. Note that in one sample (cornea #3) all 5 scans demonstrated high uncertainty in G following CXL, thus the value is displayed as an “open” triangle and omitted from analysis of the means. (C) Thickness for each individual cornea pre- and post-CXL.
Figure 8
Figure 8
The mean and standard deviation in (A) G and (B) E prior to and following ultraviolet cross-linking (CXL) in n = 5 samples.
Figure 9
Figure 9
(A) Young’s Modulus E and (B) Shear Modulus G, relative to the pre-cross-linking (CXL) value; (C) central cornea thickness relative to the pre-CXL value. Black markers are the mean and standard deviation of the relative changes between the n = 5 samples. The solid colored lines represent a linear best-fit of the relative change from each individual cornea. For 2 of the corneas, the fit for G was very poor over the last 6 minutes, so the values have been omitted from the displayed average. The post-CXL average includes 4 corneas.

Similar articles

Cited by

References

    1. Meek K.M., Boote C. The organization of collagen in the corneal stroma. Exp Eye Res. 2004;78:503–512. - PubMed
    1. Koudouna E., Winkler M., Mikula E., Juhasz T., et al. Evolution of the vertebrate corneal stroma. Prog Retin Eye Res. 2018;64:65–76. - PubMed
    1. Borcherding M.S., Blacik L.J., Sittig R.A., Bizzell J.W., et al. Proteoglycans and collagen fibre organization in human corneoscleral tissue. Exp Eye Res. 1975;21:59–70. - PubMed
    1. Scott J.E., Thomlinson A.M. The structure of interfibrillar proteoglycan bridges ('shape modules') in extracellular matrix of fibrous connective tissues and their stability in various chemical environments. J Anat. 1998;192:391–405. - PMC - PubMed
    1. Meek K.M., Knupp C. Corneal structure and transparency. Prog Retin Eye Res. 2015;49:1–16. - PMC - PubMed