. 2023 Jan 20;5(1):lqad006.
doi: 10.1093/nargab/lqad006. eCollection 2023 Mar.

Model-driven experimental design workflow expands understanding of regulatory role of Nac in Escherichia coli

Affiliations

Model-driven experimental design workflow expands understanding of regulatory role of Nac in Escherichia coli

Joon Young Park et al. NAR Genom Bioinform. .

Abstract

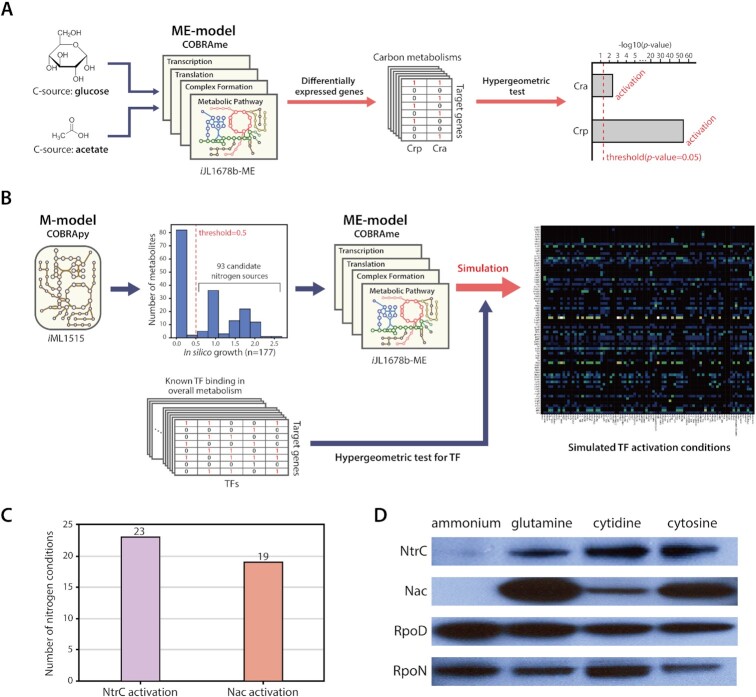
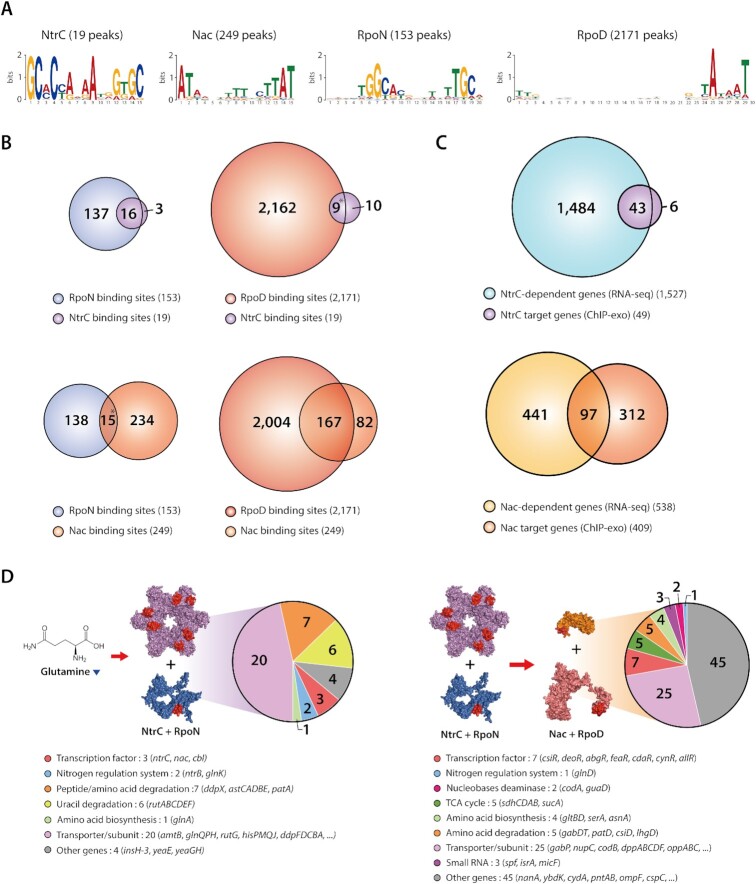
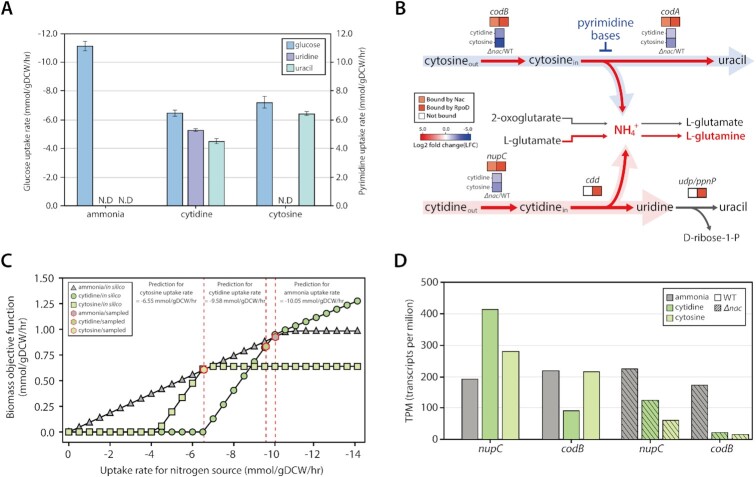
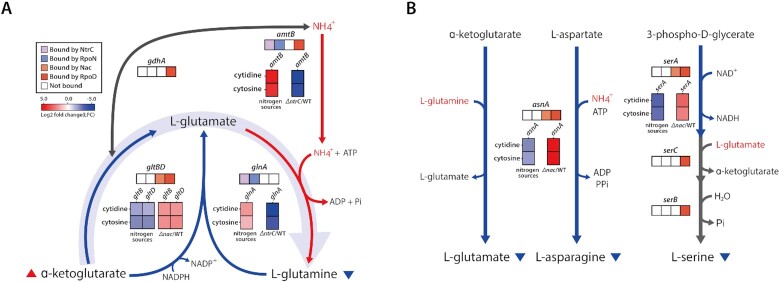
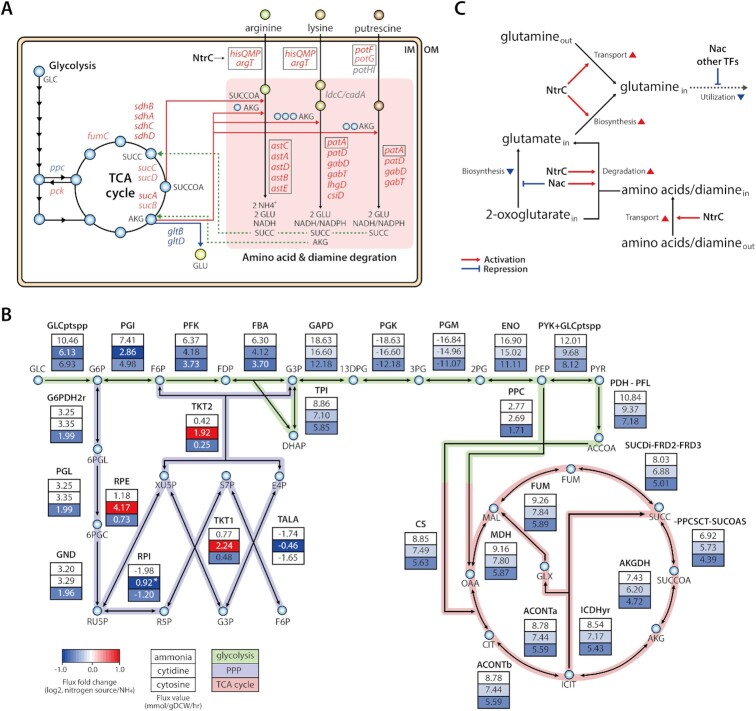
The establishment of experimental conditions for transcriptional regulator network (TRN) reconstruction in bacteria continues to be impeded by the limited knowledge of activating conditions for transcription factors (TFs). Here, we present a novel genome-scale model-driven workflow for designing experimental conditions, which optimally activate specific TFs. Our model-driven workflow was applied to elucidate transcriptional regulation under nitrogen limitation by Nac and NtrC, in Escherichia coli. We comprehensively predict alternative nitrogen sources, including cytosine and cytidine, which trigger differential activation of Nac using a model-driven workflow. In accordance with the prediction, genome-wide measurements with ChIP-exo and RNA-seq were performed. Integrative data analysis reveals that the Nac and NtrC regulons consist of 97 and 43 genes under alternative nitrogen conditions, respectively. Functional analysis of Nac at the transcriptional level showed that Nac directly down-regulates amino acid biosynthesis and restores expression of tricarboxylic acid (TCA) cycle genes to alleviate nitrogen-limiting stress. We also demonstrate that both TFs coherently modulate α-ketoglutarate accumulation stress due to nitrogen limitation by co-activating amino acid and diamine degradation pathways. A systems-biology approach provided a detailed and quantitative understanding of both TF's roles and how nitrogen and carbon metabolic networks respond complementarily to nitrogen-limiting stress.


Figures

Figure 1.
Figure 1.
Workflow of model-driven experimental design. (A) A model-driven workflow including macromolecular expression (ME-model) predicted the activation of Cra and Crp due to different carbon sources in carbon metabolisms. (B) Model-driven experimental design was achieved using genome-scale models of metabolism (M-model) and ME-model of the metabolic network in E. coli K-12 MG1655, with a list of viable nitrogen sources, and known TF binding sites. (C) Results of model-driven TF prediction. NtrC was activated on 23 nitrogen sources and Nac was activated on 19 nitrogen sources. (D) Protein expression of two major nitrogen-responsive TFs, NtrC and Nac, and two σ-factors, RpoD and RpoN, was measured by western blotting. Ammonia was used as a negative control as it is known not to activate NtrC and Nac. Glutamine was used as a positive control to activate the two TFs. Expression of NtrC and Nac increased on alternative nitrogen sources. However, Nac expression on cytidine increased significantly less than on glutamine or cytosine.
Figure 2.
Figure 2.
Genome-wide identification of NtrC and Nac binding sites and regulons associated with sigma factors. (A) Motif analysis on ChIP-exo binding sites for NtrC, Nac, RpoN and RpoD resulted in previously known sequence motifs (lower-case characters indicate an information content < 1 bit). (B) Overlaps between NtrC and RpoN or RpoD binding sites under the alternative nitrogen sources. 16 NtrC binding events out of 19 were accompanied by RpoN binding. 9 NtrC bindings were identified near RpoD binding sites. In the case of Nac, 167 Nac binding events out of 249 were accompanied by RpoD binding. 15 Nac bindings were identified near RpoN binding sites. (*9 NtrC and RpoD bindings were identified near RpoN binding sites, *15 Nac and RpoN bindings were also detected near RpoD binding sites. These cases are complicated promoters with both RpoD and RpoN binding sites.) (C) Comparison of ChIP-exo binding results and differentially expressed gene profiles to define direct NtrC and Nac regulons. (D) NtrC associates with RpoN-dependent promoters, and regulates 20 transporter genes, 7 peptide/amino acid degradation genes, 6 uracil degradation genes, 3 TF genes, 2 nitrogen regulation system genes, 1 amino acid biosynthesis genes and 4 other enzymes. Nac associates with RpoD-dependent promoters, and regulates 25 transporter genes, 7 TF genes, 5 TCA cycle genes, 5 amino acid degradation genes, 4 amino acid biosynthesis genes, 3 sRNAs, 2 nucleobases deaminase genes, 1 nitrogen regulation system gene and 45 other enzymes (3D structure of Nac, RpoD, NtrC and RpoN were predicted by AlphaFold).
Figure 3.
Figure 3.
Different transcriptional regulatory response by Nac under cytidine and cytosine. (A) Glucose uptake rate and pyrimidine export rate measured by HPLC under alternative nitrogen sources. (B) Different metabolic enzymes of cytidine and cytosine regulated by Nac with RpoD or only RpoD. Cytidine and cytosine are transported by nupC and codB, respectively. These genes are activated by Nac with RpoD. Then, through cytosine deaminase (codA), regulated by Nac and RpoD, cytosine is degraded to uracil and ammonium ion. However, cytidine is converted to uridine and ammonium ion by cytidine deaminase (cdd), which is transcribed by only RpoD. (C) Prediction of nitrogen uptake rate for different nitrogen sources. Simulation of flux balance analysis (FBA) used experimentally measured glucose uptake rate and extracellular pyrimidine export rate to calculate nitrogen source uptake rates (ammonia shown as triangles; cytidine shown as circles; cytosine shown as squares). Sample points for flux analysis are also denoted (shown as red-lined hexagons). (D) Changes in mRNA expression of cytidine and cytosine transporters on different nitrogen sources. Cytidine transporter (nupC) is significantly up-regulated on cytidine, but cytosine transporter (codB) expression doesn’t change on cytosine. Both transporters are significantly down-regulated in the nac deletion strain. This indicates that Nac up-regulates the expression of both genes.
Figure 4.
Figure 4.
Regulatory mechanisms of amino acid metabolism enzymes by Nac and NtrC under unfavorable nitrogen sources. (A) When exposed to unfavorable nitrogen sources, the low ammonium ion concentration decreases nitrogen incorporation from ɑ-ketoglutarate to amino acids. This decreases the concentration of cytoplasmic glutamine and increases the concentration of ɑ-ketoglutarate. Glutamine-producing genes are activated by NtrC, and glutamine consumption genes are repressed by Nac. In E. coli, NtrC and Nac play an important role in maintaining glutamine concentration. (B) Amino acid biosynthesis genes regulated by Nac. Nac directly down-regulates glutamate synthase and asparagine synthetase, which utilize glutamine or ammonium ions. Additionally, enzyme of initial step in serine biosynthesis is repressed by Nac under nitrogen-limiting conditions. (The left stack denotes the relative expression of genes between alternative nitrogen sources and ammonia, right stack indicates the relative expression of genes between TF deletion strain and wild-type strain under alternative nitrogen sources, respectively.)
Figure 5.
Figure 5.
Network-level regulation of carbon metabolism and amino acid and diamine degradation pathways by Nac and NtrC. (A) Carbon metabolism (glycolysis and TCA cycle) and amino acid/diamine degradation pathways are represented. Nac regulates the expression of enzymes in the TCA cycle, including ppc, pck, sdhBADC, sucCD, sucAB and fumC. Transporters or their subunits of amino acids and diamine are up-regulated by NtrC. In amino acid/diamine degradation pathways, the astCADBE operon and patA are activated by NtrC, which encode the enzymes in the arginine and lysine/putrescine degradation pathways, respectively. Moreover, Nac significantly up-regulates lysine/putrescine degradation enzymes that are encoded patD, gabTD, csiD and lhgD. Two lysine degradation genes (ldcC and cadA) and putrescine transporter subunits (potHI) are not regulated by NtrC and Nac. The genes regulated by Nac or NtrC are depicted by bright red (LFC > 1), bright blue (LFC < −1), light red (0.5 < LFC < 1), and light blue (−1 < LFC < −0.5), respectively. And the genes regulated by NtrC are depicted by black boxes. Abbreviation: GLC: glucose, AKG: ɑ-ketoglutarate, SUCCOA: succinyl-CoA, SUCC: succinate, GLU: glutamate, IM, inner membrane; OM, outer membrane. (B) To explain lower activation of Nac on cytidine condition MCMC sampling was performed on ammonia, cytidine, and cytosine with experimentally measured glucose uptake rate and pyrimidine export rates. (There are genes and reactions with minor flux that are omitted for clarity of Figure. *The flux through the reaction was lower than the flux on ammonia; however, the direction of the reaction was reversed.) (C) An overview of the Nac and NtrC regulons under nitrogen limitation. Both TFs induce the conversion of glutamate from ɑ-ketoglutarate and amino acids without using glutamine, to modulate stress response to nitrogen deficiency and accumulated ɑ-ketoglutarate.

Similar articles

Cited by

References

    1. Shimada T., Ishihama A., Busby S.J., Grainger D.C.. The Escherichia coli RutR transcription factor binds at targets within genes as well as intergenic regions. Nucleic Acids Res. 2008; 36:3950–3955. - PMC - PubMed
    1. Myers K.S., Yan H., Ong I.M., Chung D., Liang K., Tran F., Keles S., Landick R., Kiley P.J.. Genome-scale analysis of escherichia coli FNR reveals complex features of transcription factor binding. PLoS Genet. 2013; 9:e1003565. - PMC - PubMed
    1. Park D.M., Akhtar M.S., Ansari A.Z., Landick R., Kiley P.J.. The bacterial response regulator ArcA uses a diverse binding site architecture to regulate carbon oxidation globally. PLos Genet. 2013; 9:e1003839. - PMC - PubMed
    1. Cho B.K., Knight E.M., Palsson B.O.. Transcriptional regulation of the fad regulon genes of Escherichia coli by ArcA. Microbiology. 2006; 152:2207–2219. - PubMed
    1. Kim D., Seo S.W., Gao Y., Nam H., Guzman G.I., Cho B.-K., Palsson B.O.. Systems assessment of transcriptional regulation on central carbon metabolism by Cra and CRP. Nucleic Acids Res. 2018; 46:2901–2917. - PMC - PubMed