. 2022 Aug 6:21:595-611.
doi: 10.1016/j.bioactmat.2022.07.032. eCollection 2023 Mar.

Dynamic degradation patterns of porous polycaprolactone/β-tricalcium phosphate composites orchestrate macrophage responses and immunoregulatory bone regeneration

Affiliations

Dynamic degradation patterns of porous polycaprolactone/β-tricalcium phosphate composites orchestrate macrophage responses and immunoregulatory bone regeneration

Hao Wu et al. Bioact Mater. .

Abstract

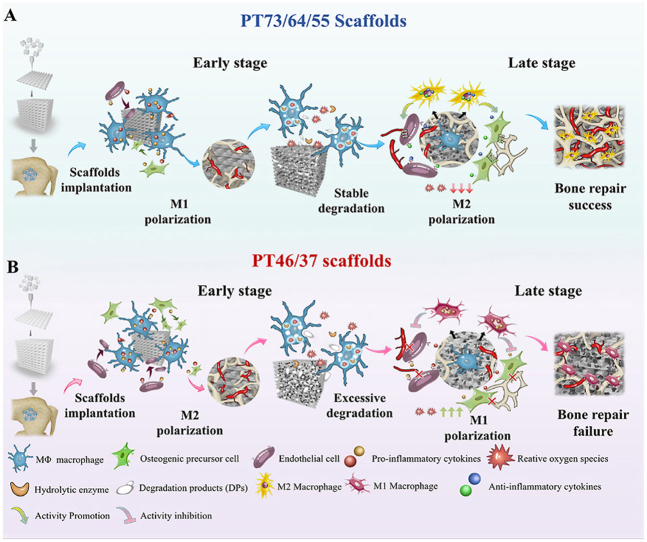
Biodegradable polycaprolactone/β-tricalcium phosphate (PT) composites are desirable candidates for bone tissue engineering applications. A higher β-tricalcium phosphate (TCP) ceramic content improves the mechanical, hydrophilic and osteogenic properties of PT scaffolds in vitro. Using a dynamic degradation reactor, we established a steady in vitro degradation model to investigate the changes in the physio-chemical and biological properties of PT scaffolds during degradation.PT46 and PT37 scaffolds underwent degradation more rapidly than PT scaffolds with lower TCP contents. In vivo studies revealed the rapid degradation of PT (PT46 and PT37) scaffolds disturbed macrophage responses and lead to bone healing failure. Macrophage co-culture assays and a subcutaneous implantation model indicated that the scaffold degradation process dynamically affected macrophage responses, especially polarization. RNA-Seq analysis indicated phagocytosis of the degradation products of PT37 scaffolds induces oxidative stress and inflammatory M1 polarization in macrophages. Overall, this study reveals that the dynamic patterns of biodegradation of degradable bone scaffolds highly orchestrate immune responses and thus determine the success of bone regeneration. Therefore, through evaluation of the biological effects of biomaterials during the entire process of degradation on immune responses and bone regeneration are necessary in order to develop more promising biomaterials for bone regeneration.

Keywords: Bone healing; Dynamic degradation; Macrophage response; Polycaprolactone/β-TCP.


Conflict of interest statement

The authors declare that they have no known competing financial interests or personal relationships that could have appeared to influence the work reported in this paper.

Figures

Image 1
Graphical abstract
Scheme 1
Scheme 1
Schematic illustration of the mechanisms of scaffold degradation-mediated macrophage polarization and bone healing processes. A) Degradation of typical PT 55 scaffolds mediates sequential macrophage M1-M2 polarization and a matched “slow early-fast afterwards” bone regeneration mode. B) Degradation of typical PT37 scaffolds mediates ROS generation by macrophages, constant M1 polarization and a disordered “fast initially-slow in late stage” bone regeneration mode.
Fig. 1
Fig. 1
Characterization of biodegradable PCL/β-TCP (PT) bone scaffolds with different mass ratios. A) a1-a5, Morphologic views of PT scaffolds prepared by FDM with mass ratios ranging from 70/30 (PT73) to 30/70 (PT37); scale bar: 5 mm; b1-b5, Micro-CT reconstructions of PT scaffolds; scale bar: 1 mm; c1-c5, Microstructure of cross-linked PT scaffolds observed by SEM; magnification, 1000 × ; d1-d5, Assessment of the biocompatibility of PT scaffolds towards L929 fibroblasts; scale bar: 20 μm. (B) Statistical analysis of scaffold porosity, n = 3. (C) Representative normalized compression-deformation curves of PT scaffolds. (D) Water contact angles of PT scaffolds. (E) Compressive moduli of PT scaffolds (n = 3). (F) Elemental distribution (Ca P) of sectioned PT scaffolds; scale bar: 100 μm. (G) Statistical analysis of the water contact angle of PT scaffolds, n = 4. (H) ALP staining and Alizarin red staining of osteogenesis in MC-3T3 osteoblasts cultured with PT scaffolds in vitro; scale bar = 200 μm. (I) Statistical analysis of the elemental compositions of sectioned PT scaffolds; n = 3. ns: not significant, *P < 0.05, **P < 0.01, and ***P < 0.001. vs. PT73 scaffolds, one-way ANOVA with Dunnett's post-hoc test.
Fig. 2
Fig. 2
Dynamic biodegradation of PT scaffolds in vitro. (A) a-b, Schematic illustration of the dynamic biodegradation reactor and degradation medium perfused through the PT scaffolds. (B) SEM analysis of the effects of degradation media including hydrochloric acid (180 min), sodium hydroxide (180 min), lipase solution (24 h) and hydrogen peroxide (24 h) on PT37 scaffolds, scale bar = 10 μm. Dilute sodium hydroxide was selected for the subsequent experiments. (C) Changes in the general appearance of PT scaffolds (scale bar = 5 mm) and (D) corresponding surface morphologies of PT scaffolds observed by SEM (scale bar = 10 μm) after 30–360 min degradation. (E) Typical compression-deformation curves of PT scaffolds after 30-, 60-, 180-, and 360-min degradation. (F–H) Dynamic changes in the compressive moduli, percentage weight loss and remaining molecular weight of PT scaffolds during 360-min degradation, n = 3. *P < 0.05, **P < 0.01, and ***P < 0.001. vs. PT73 scaffolds, one-way ANOVA with Dunnett's post-hoc test.
Fig. 3
Fig. 3
(A) Schematic illustration of stable scaffold degradation and enhanced bone repair in the defects implanted with PT73, PT64 and PT55 scaffolds, and the rapid scaffold degradation and limited bone repair in defects implanted with PT46 and PT37 scaffolds. (B) Representative reconstructions of micro-CT images of implanted PT scaffolds (blue color) and bone in-growth (yellow color) at 4-, 10- and 16-weeks post-implantation; scale bar = 2 mm. (C) Representative Masson staining images showing new bone tissue around the PT scaffolds at 4-, 10- and 16-weeks post-implantation; scale bar = 100 μm. (D) Representative images of calcein/alizarin red labeling showing the rate of bone growth at 4-, 10- and 16-weeks post-implantation; scale bar = 100 μm. (E) Quantitative measurements of the new bone volume ratio (BV/TV) and residual material volume ratio (MV/TV) in the micro-CT region of interest (ROI) at 4-, 10- and 16-weeks post-implantation; n = 3. (F) Histological measurement of new bone area (%) at the implant site based on Masson staining, n = 3. (G) Bone formation rate/Bome surface, (BFR/BS) in the implant zone, n = 3. ns: not significant, *P < 0.05, **P < 0.01 and ***P < 0.001. vs. PT73 scaffolds, two-way ANOVA with Dunnett's post-hoc test.
Fig. 4
Fig. 4
Modes of scaffold degradation and immunological responses to PT scaffolds. (A) SEM analysis of the morphological changes during scaffold degradation and bone ingrowth at the implant-bone interface in defects implanted with PT73, PT55 and PT37 scaffolds at 4-, 10- and 16-weeks post-implantation; scale bar = 50 μm. (B) Segmentation of the degraded scaffolds in the micro-CT reconstructions of the defect zones at 4-, 10- and 16-weeks post-implantation, scale bar = 2 mm. (C) Representative images of multi-nuclear giant cells (MNGCs, black arrow) inside the defect zone at 10- and 16-weeks post-implantation of PT37 scaffolds; scale bar = 20 µm. (D) Representative immunofluorescence images of CD68+ macrophages and CCR7+ M1 and CD206+ M2 polarization in the defect zone at 4, 10 and 16 weeks; scale bar = 100 µm. (E) Quantitative measurements of the residual material volume ratio (MV/TV) in the micro-CT region of interest (ROI) at 4-, 10- and 16-weeks post-implantation; n = 3. (F) Semi-quantitative analysis of the ratio of CC7+/CD68+ cells; n = 3. G) Semi-quantitative analysis of the ratio of CD206+/CD68+ cells; n = 3. ns: not significant, *P < 0.05, ** P < 0.01, and *** P < 0.001 vs. PT73 scaffolds, two-way ANOVA with Dunnett’s post-hoc test.
Fig. 5
Fig. 5
Matching the stages of degradation of PT scaffolds in vitro and in vivo. (A) Morphological observation and elemental distribution mappings of PT scaffolds at 4, 10 and 16 weeks; scale bar = 10 μm. (B) Determination of scaffolds in the early degradation stage (D1), mid-degradation stage (D2) and late degradation stage (D3) based on SEM observations and EDS analysis of elemental distribution; scale bar = 10 μm. (C) Matching scaffolds degraded in vivo at 4, 10 and 16 weeks with in vitro degraded scaffolds at the D1, D2 and D3 stage based on statistical analysis of their elemental compositions, n = 3.
Fig. 6
Fig. 6
Scaffold degradation induces dynamic processes of macrophage polarization. (A) Schematic illustration of the effects of scaffolds at different stages of degradation on macrophage polarization and cytokine secretion. (B) BIOSEM analysis of the morphological changes in macrophages on the surface of PT73, PT55 and PT37 scaffolds at the D1‒D3 stages; scale bar = 10 μm. (C) Representative immunofluorescent analysis of CD86 and CD206 expression (scale bar = 100 μm) and (D) Western blot analysis of the expression of the M1 macrophage marker iNOS and the M2 macrophage marker Arginase-1 in RAW264.7 macrophages cultured with degraded scaffolds at the D1‒D3 stages. (E–G) ELISAs of the levels of the proinflammatory cytokines TNF-α and IL-6 and the anti-inflammatory cytokines IL-10 in RAW264.7 macrophages cultured with degraded scaffolds at the D1‒D3 stages, n = 3. ns: not significant, *P < 0.05, **P < 0.01, and ***P < 0.001, two-way ANOVA with Turkey's post-hoc test.
Fig. 7
Fig. 7
Tissue immune responses to subcutaneously implanted degraded scaffolds. (A) Schematic illustration of the effects of subcutaneously implanted scaffolds at different stages of degradation on tissue immune responses in a rat model. (B) Representative immunofluorescence images of CD68+ macrophages and CCR7+ M1 and CD206+ M2 polarization in the defect zone for scaffolds at different stages of degradation; scale bar = 100 μm. (C) Semiquantitative analysis of the ratio of CC7+/CD68+ cells, n = 3. (D) Semiquantitative analysis of the ratio of CD206+/CD68+ cells, n = 3.
Fig. 8
Fig. 8
RNA-seq analysis of macrophages cultured with degraded PT55 VS PT37 scaffolds in vitro. (A–B) Volcano plot, (B) heatmap diagram, (C) GO pathway enrichment, (D) KEGG pathway classification, (E) interaction network analysis and (F) candidate gene interaction network analysis of differentially expressed genes (DEGs) in macrophages in the D2 PT55 scaffold vs. D2 PT37 scaffold groups. ns: not significant, *P < 0.05, **P < 0.01, and ***P < 0.001 vs. PT37 D2 group, one-way or two-way ANOVA with Dunnett's post-hoc test.
Fig. 9
Fig. 9
Degraded PT37 scaffolds induce oxidative stress and polarization changes in macrophages. (A) Macrophages were cultured with scaffolds at the D2 stage of degradation for 24 h and lysosomes were labeled with Lysotracker (red); scale bar = 100 μm. (B) Quantitation of the relative fluorescence intensity of Lysotracker in (A), n = 3. (C) TEM analysis of macrophage phagocytosis of the degradation products (DPs) of scaffolds at the D2 stage. The black boxes in the upper panel indicate the DPs and phagosome formation; scale bar = 500 nm. (D) Quantitative calculation of the mean diameter of phagosomes in (C); n = 3. (E) Western blotting of NOX-2, SOD and GAPDH protein expression in macrophages cultured with scaffolds at the D2 stages of degradation. (F) Representative flow cytometry analysis intracellular reactive oxygen species intensity of macrophages cultured with scaffolds at D2 stage of degradation. (G) Representative immunofluorescence images of CD86 and CD206 expression in RAW264.7 macrophages cultured with PT37 scaffolds at the D2 stage of degradation; cells were pretreated with or without chlorpromazine or latrunculin B before co-culture, scale bar = 100 μm. (H) Western blot analysis of NOX-2 and SOD in RAW264.7 macrophages cultured with PT37 scaffolds at the D2 stage of degradation and pretreated with chlorpromazine or latrunculin B before coculture.

Similar articles

Cited by

References

    1. Wubneh A., Tsekoura E.K., Ayranci C., Uludag H. Current state of fabrication technologies and materials for bone tissue engineering. Acta Biomater. 2018;80:1–30. doi: 10.1016/j.actbio.2018.09.031. - DOI - PubMed
    1. Roseti L., Parisi V., Petretta M., Cavallo C., Desando G., Bartolotti I., Grigolo B. Scaffolds for bone tissue engineering: state of the art and new perspectives. Mater. Sci. Eng. C. Mater. Biol. Appl. 2017;78:1246–1262. doi: 10.1016/j.msec.2017.05.017. - DOI - PubMed
    1. Agarwal R., Garcia A.J. Biomaterial strategies for engineering implants for enhanced osseointegration and bone repair. Adv. Drug Deliv. Rev. 2015;94:53–62. doi: 10.1016/j.addr.2015.03.013. - DOI - PMC - PubMed
    1. Hollinger J.O., Battistone G.C. Biodegradable bone repair materials. Synthetic polymers and ceramics. Clin. Orthop. Relat. Res. 1986;207:290–305. - PubMed
    1. Bharadwaz A., Jayasuriya A.C. Recent trends in the application of widely used natural and synthetic polymer nanocomposites in bone tissue regeneration. Mater. Sci. Eng. C. Mater. Biol. Appl. 2020;110 doi: 10.1016/j.msec.2020.110698. - DOI - PMC - PubMed

LinkOut - more resources