

Whole-genome characterization of large-cell lung carcinoma: A comparative analysis based on the histological classification
- PMID: 36685819
- PMCID: PMC9845284
- DOI: 10.3389/fgene.2022.1070048
Whole-genome characterization of large-cell lung carcinoma: A comparative analysis based on the histological classification
Abstract
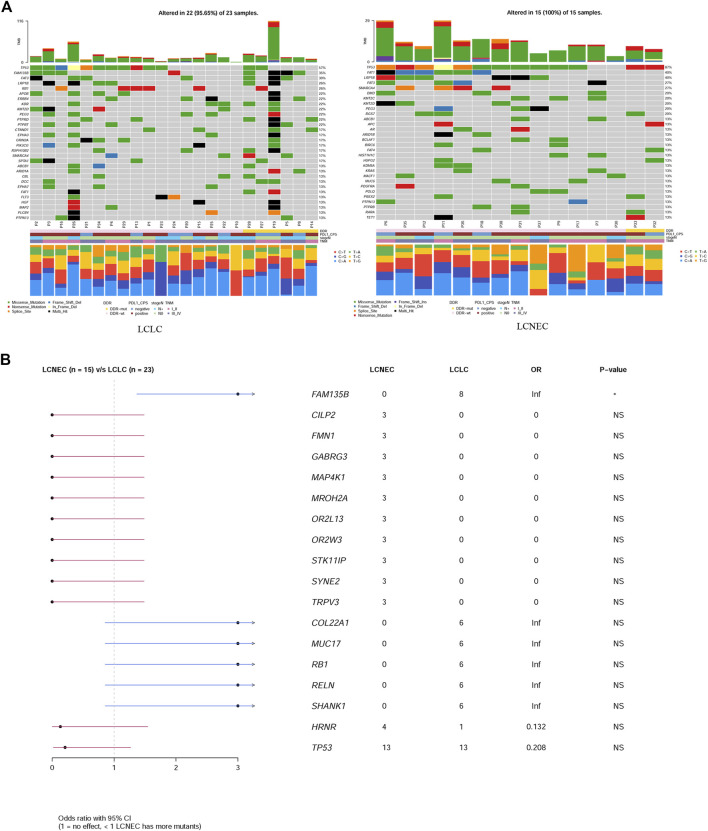
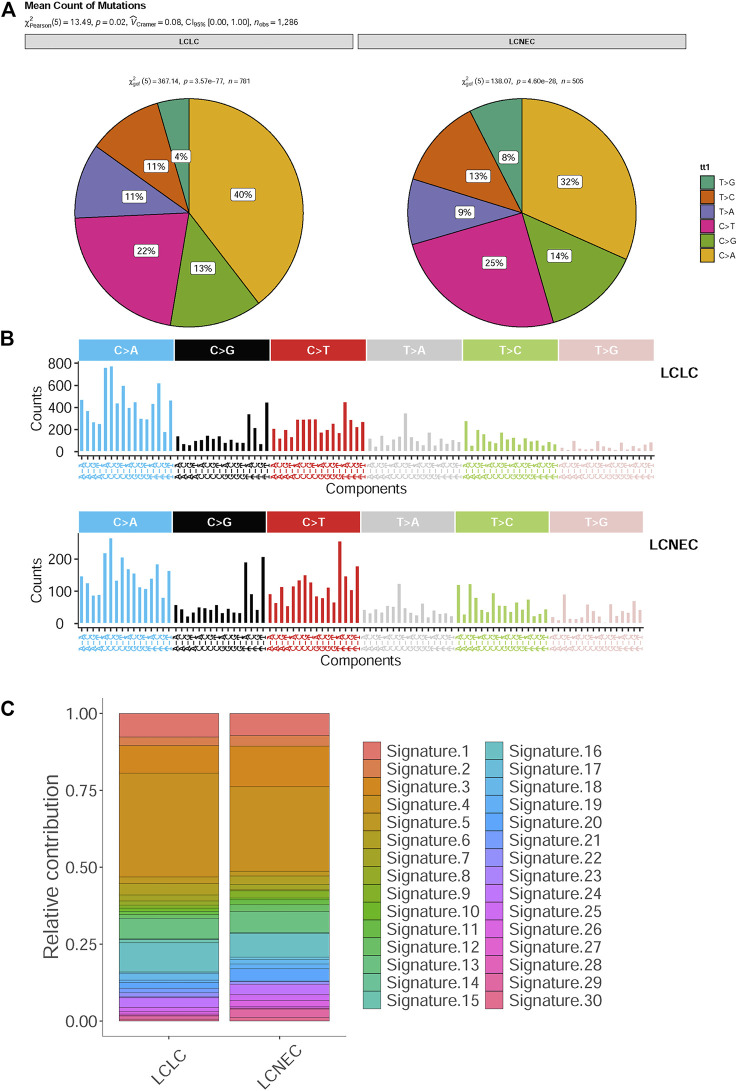
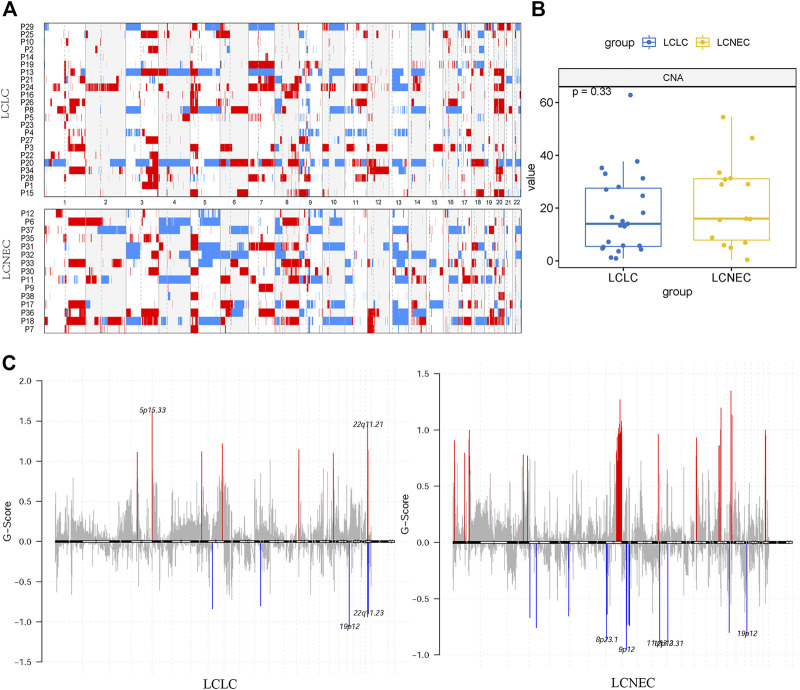
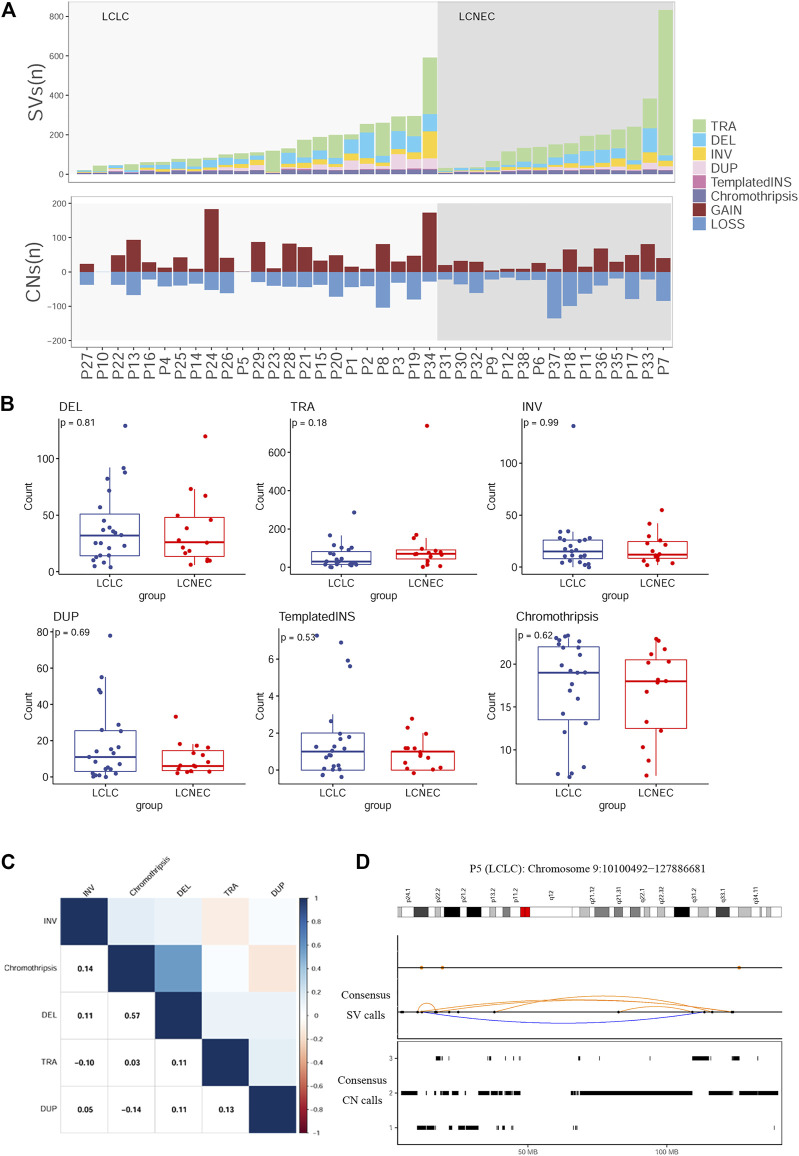
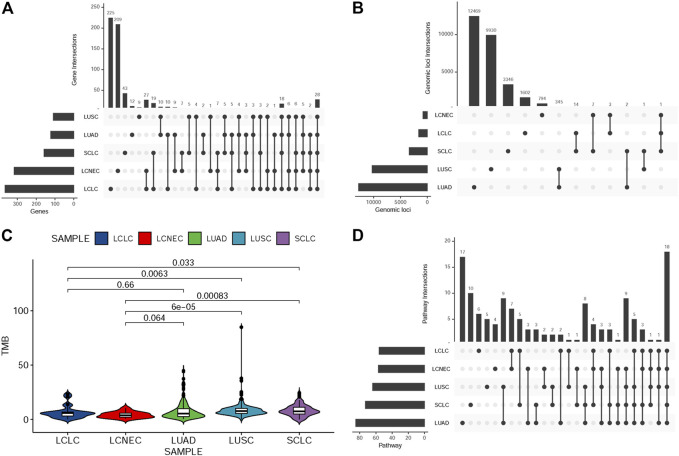
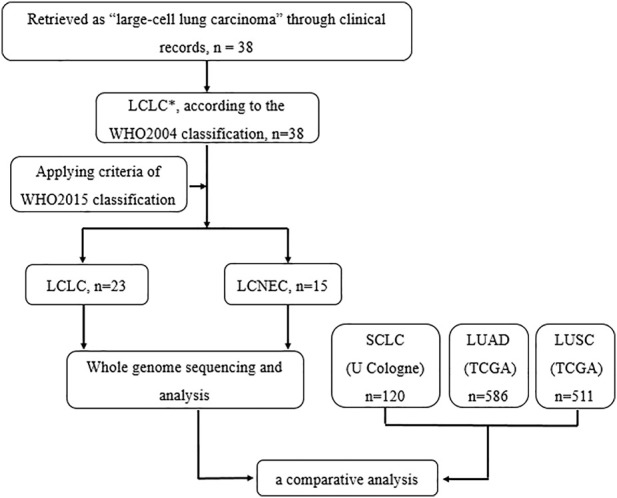
Background: According to the 2015 World Health Organization classification, large cell neuroendocrine carcinoma (LCNEC) was isolated from Large-cell lung cancer (LCLC) tumors, which constitutes 2%-3% of non-small cell lung cancer (NSCLC). However, LCLC tumors are still fairly vaguely defined at the molecular level compared to other subgroups. Materials and Methods: In this study, whole-genome sequencing (WGS) was performed on 23 LCLC and 15 LCNEC tumor specimens. Meanwhile, data from the TCGA (586 LUADs and 511 LUSCs) and U Cologne (120 SCLCs) were analyzed and compared. Results: The most common driver mutations were found in TP53 (13/23, 57%), FAM135B (8/23, 35%) and FAT3 (7/23, 30%) in LCLC, while their counterparts in LCNEC were TP53 (13/15, 87%), LRP1B (6/15, 40%) and FAT1 (6/15, 40%). Notably, FAM135B mutations only occurred in LCLC (P = 0.013). Cosmic signature analysis revealed widespread defective DNA mismatch repair and tobacco-induced mutations in both LCLC and LCNEC. Additionally, LCNEC had a higher incidence of chromosomal copy number variations (CNVs) and structural variations (SVs) compared with LCLC, although the differences were not statistically significant. Particularly, chromothripsis SVs was significantly associated with CNVs. Furthermore, mutational landscape of different subtypes indicated differences between subtypes, and there seems to be more commonalty between our cohort and SCLC than with other subtypes. SMARCA4 mutations may be specific driver gene alteration in our cohort. Conclusion: Our results support that LCLC and LCNEC tumors follow distinct tumorigenic pathways. To our knowledge, this is the first genome-wide profiling comparison of LCLC and LCNEC.
Keywords: Large-cell lung cancer (LCLC); histological classification; large cell neuroendocrine carcinoma (LCNEC); non-small cell lung cancer (NSCLC); whole-genome sequencing.
Copyright © 2023 Wu, Yin, Deng and Zu.
Conflict of interest statement
The authors declare that the research was conducted in the absence of any commercial or financial relationships that could be construed as a potential conflict of interest.
Figures
Similar articles
-
Gene Expression Profiling of Large Cell Lung Cancer Links Transcriptional Phenotypes to the New Histological WHO 2015 Classification.J Thorac Oncol. 2017 Aug;12(8):1257-1267. doi: 10.1016/j.jtho.2017.05.008. Epub 2017 May 20. J Thorac Oncol. 2017. PMID: 28535939
-
Comparison of genomic landscapes of large cell neuroendocrine carcinoma, small cell lung carcinoma, and large cell carcinoma.Thorac Cancer. 2019 Apr;10(4):839-847. doi: 10.1111/1759-7714.13011. Epub 2019 Feb 21. Thorac Cancer. 2019. PMID: 30793508 Free PMC article.
-
Next-Generation Sequencing of Pulmonary Large Cell Neuroendocrine Carcinoma Reveals Small Cell Carcinoma-like and Non-Small Cell Carcinoma-like Subsets.Clin Cancer Res. 2016 Jul 15;22(14):3618-29. doi: 10.1158/1078-0432.CCR-15-2946. Epub 2016 Mar 9. Clin Cancer Res. 2016. PMID: 26960398 Free PMC article.
-
Prevalence of TP-53/Rb-1 Co-Mutation in Large Cell Neuroendocrine Carcinoma.Front Oncol. 2021 May 31;11:653153. doi: 10.3389/fonc.2021.653153. eCollection 2021. Front Oncol. 2021. PMID: 34141612 Free PMC article.
-
Update on large cell neuroendocrine carcinoma.Transl Lung Cancer Res. 2017 Oct;6(5):530-539. doi: 10.21037/tlcr.2017.06.12. Transl Lung Cancer Res. 2017. PMID: 29114469 Free PMC article. Review.
Cited by
-
Case Report: Three cases of lung large cell neuroendocrine carcinoma with clinicopathological features of SMARCA4 (BRG1) deficiency.Front Oncol. 2025 Jun 30;15:1538548. doi: 10.3389/fonc.2025.1538548. eCollection 2025. Front Oncol. 2025. PMID: 40661782 Free PMC article.
References
-
- Brambilla E., Nicholson A. G., Burke A., Travis W. D. (Editors) (2015). WHO classification of tumours of the lung, pleura, thymus and heart (Lyon: IARC Press; ). - PubMed
LinkOut - more resources
Full Text Sources
Research Materials
Miscellaneous