. 2023 Jan 6:13:1100787.
doi: 10.3389/fgene.2022.1100787. eCollection 2022.

High expression of KNL1 in prostate adenocarcinoma is associated with poor prognosis and immune infiltration

Affiliations

High expression of KNL1 in prostate adenocarcinoma is associated with poor prognosis and immune infiltration

Yetao Zhang et al. Front Genet. .

Abstract

Prostate adenocarcinoma (PRAD) is a common malignancy with increasing morbidity and mortality. Kinetochore scaffold 1 (KNL1) has been reported to be involved in tumor progression and prognosis in other tumors, but its role in PRAD has not been reported in detail. KNL1 expression analysis, clinicopathological parameters analysis, prognostic correlation analysis, molecular interaction network and functional abdominal muscle analysis and immune infiltration analysis by using multiple online databases and downloaded expression profile. The results suggest that KNL1 is highly expressed in PRAD, which is associated with worse prognosis in PRAD patients. KnL1-related genes are highly enriched in mitotic function, which is considered to be highly related to the development of cancer. Finally, KNL1 expression is associated with a variety of tumor infiltrating immune cells, especially Treg and Th2 cells. In conclusion, our findings provide preliminary evidence that KNL1 may be an independent prognostic predictor of PRAD and is associated with immune infiltration.

Keywords: Knl1; bioinformatics analysis; immune infiltration; prognosis; prostate adenocarcinoma.


Conflict of interest statement

The authors declare that the research was conducted in the absence of any commercial or financial relationships that could be construed as a potential conflict of interest.

Figures
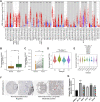
FIGURE 1
FIGURE 1
KNL1 expression levels in human cancers. (A) KNL1 mRNA levels in different tumor types from TCGA database were determined by TIMER. (B) KNL1 is expressed at higher levels in PRAD than in non-cancerous adjacent tissues. (C) mRNA expression levels of DRP1 in matched PRAD and adjacent non-cancerous samples in the TCGA database were compared. (D) Correlations between KNL1 expression and molecular subtypes in PRAD. (E) Correlations between KNL1 expression and immune subtypes in PRAD. (F) KNL1 protein levels in normal prostate and PRAD were visualized using immunohistochemistry via HPA. (*p < .05, **p < .01, ***p < .001). (G) qRT-PCR analysis of KNL1 expression in normal human prostate cell line (RWPE-1) and five prostate cancer cell lines (DU-145, 22RV1, VCaP, PC-3, LNCaP). *p < .05, **p < .01, ***p < .001.
FIGURE 2
FIGURE 2
Associations between KNL1 expression and different clinical characteristics in PRAD. (A) Age; (B) PSA (ng/ml); (C) Gleason score; (D) T stage; (E) N grade; (F) M grade. (G) Primary therapy outcome; (H) Residual tumor (*p < .05, **p < .01, ***p < .001).
FIGURE 3
FIGURE 3
Correlation between KNL1 and the prognosis. KNL1 expression was significantly negatively correlated with OS (A) and PFI (B) in TCGA. (C) Receiver operating characteristic (ROC) curve for KNL1 expression in PRAD. (D) Forest map of KNL1 expression and other clinicopathological parameters.
FIGURE 4
FIGURE 4
Co-expression genes of KNL1. (A) Network of the top 20 genes associated with KNL1 in GeneMANIA. (B) STRING. (C) Correlation analysis of KNL1 and its co-expressed genes.
FIGURE 5
FIGURE 5
Screening and functional enrichment analysis of related genes. (A) Volcano plot for single-gene difference analysis (|LogFC|>1, p. adj<.05). (B) Correlation Heatmap for Single Gene Difference Analysis (|LogFC|>2, p. adj<.01). GO (C) and KEGG (D) analysis of 300 genes positively correlated with KNL1.
FIGURE 6
FIGURE 6
Correlation between KNL1 expression and TIICs. (A) Correlation between KNL1 expression and six types of immune cells in the TIMER database. (B) Lollipop graphs of correlation between KNL1 and biomarkers of 24 immune cells. (C) The distribution of 24 subtypes of immune cells in low and high KNL1 expression group. (D) GSEA analysis of differential genes in immune-related datasets by single-gene analysis. (Ns: no significance; *p < .05; **p < .01; ***p < .001).

Similar articles

Cited by

References

    1. Abida W., Cheng M. L., Armenia J., Middha S., Autio K. A., Vargas H. A., et al. (2019). Analysis of the prevalence of microsatellite instability in prostate cancer and response to immune checkpoint blockade. JAMA Oncol. 5 (4), 471–478. 10.1001/jamaoncol.2018.5801 - DOI - PMC - PubMed
    1. Amoozgar Z., Kloepper J., Ren J., Tay R. E., Kazer S. W., Kiner E., et al. (2021). Targeting Treg cells with GITR activation alleviates resistance to immunotherapy in murine glioblastomas. Nat. Commun. 12 (1), 2582. 10.1038/s41467-021-22885-8 - DOI - PMC - PubMed
    1. Andriole G. L., Crawford E. D., Grubb R. L., 3rd, Buys S. S., Chia D., Church T. R., et al. (2009). Mortality results from a randomized prostate-cancer screening trial. N. Engl. J. Med. 360 (13), 1310–1319. 10.1056/NEJMoa0810696 - DOI - PMC - PubMed
    1. Bai T., Zhao Y., Liu Y., Cai B., Dong N., Li B. (2019). Effect of KNL1 on the proliferation and apoptosis of colorectal cancer cells. Technol. Cancer Res. Treat. 18, 1533033819858668. 10.1177/1533033819858668 - DOI - PMC - PubMed
    1. Bindea G., Mlecnik B., Tosolini M., Kirilovsky A., Waldner M., Obenauf A. C., et al. (2013). Spatiotemporal dynamics of intratumoral immune cells reveal the immune landscape in human cancer. Immunity 39 (4), 782–795. 10.1016/j.immuni.2013.10.003 - DOI - PubMed