

A prognostic model based on clusters of molecules related to epithelial-mesenchymal transition for idiopathic pulmonary fibrosis
- PMID: 36685840
- PMCID: PMC9853015
- DOI: 10.3389/fgene.2022.1109903
A prognostic model based on clusters of molecules related to epithelial-mesenchymal transition for idiopathic pulmonary fibrosis
Abstract
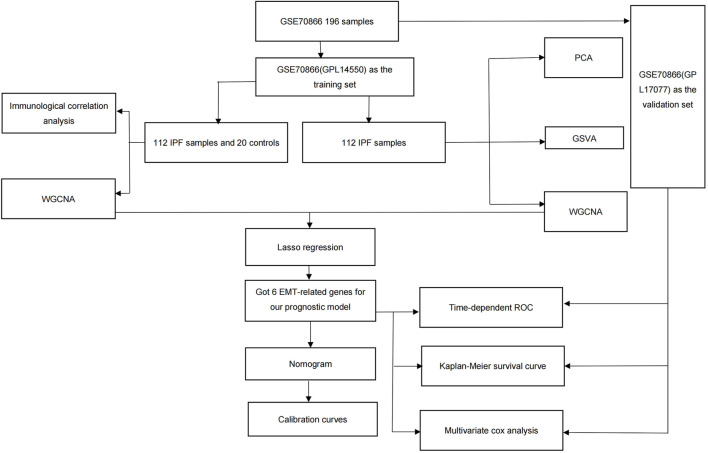
Background: Most patients with idiopathic pulmonary fibrosis (IPF) have poor prognosis; Effective predictive models for these patients are currently lacking. Epithelial-mesenchymal transition (EMT) often occurs during idiopathic pulmonary fibrosis development, and is closely related to multiple pathways and biological processes. It is thus necessary for clinicians to find prognostic biomarkers with high accuracy and specificity from the perspective of Epithelial-mesenchymal transition. Methods: Data were obtained from the Gene Expression Omnibus database. Using consensus clustering, patients were grouped based on Epithelial-mesenchymal transition-related genes. Next, functional enrichment analysis was performed on the results of consensus clustering using gene set variation analysis. The gene modules associated with Epithelial-mesenchymal transition were obtained through weighted gene co-expression network analysis. Prognosis-related genes were screened via least absolute shrinkage and selection operator (LASSO) regression analysis. The model was then evaluated and validated using survival analysis and time-dependent receiver operating characteristic (ROC) analysis. Results: A total of 239 Epithelial-mesenchymal transition-related genes were obtained from patients with idiopathic pulmonary fibrosis. Six genes with strong prognostic associations (C-X-C chemokine receptor type 7 [CXCR7], heparan sulfate-glucosamine 3-sulfotransferase 1 [HS3ST1], matrix metallopeptidase 25 [MMP25], murine retrovirus integration site 1 [MRVI1], transmembrane four L6 family member 1 [TM4SF1], and tyrosylprotein sulfotransferase 1 [TPST1]) were identified via least absolute shrinkage and selection operator and Cox regression analyses. A prognostic model was then constructed based on the selected genes. Survival analysis showed that patients with high-risk scores had worse prognosis based on the training set [hazard ratio (HR) = 7.31, p < .001] and validation set (HR = 2.85, p = .017). The time-dependent receiver operating characteristic analysis showed that the area under the curve (AUC) values in the training set were .872, .905, and .868 for 1-, 2-, and 3-year overall survival rates, respectively. Moreover, the area under the curve values in the validation set were .814, .814, and .808 for 1-, 2-, and 3-year overall survival rates, respectively. Conclusion: The independent prognostic model constructed from six Epithelial-mesenchymal transition-related genes provides bioinformatics guidance to identify additional prognostic markers for idiopathic pulmonary fibrosis in the future.
Keywords: bioinformatics; bronchoalveolar lavage cells; epithelial-mesenchymal transition; idiopathic pulmonary fibrosis; prognostic model.
Copyright © 2023 Zhao, Wang, Fan, Liu and Zhang.
Conflict of interest statement
The authors declare that the research was conducted in the absence of any commercial or financial relationships that could be construed as a potential conflict of interest.
Figures


Similar articles
-
Identification of three hub genes related to the prognosis of idiopathic pulmonary fibrosis using bioinformatics analysis.Int J Med Sci. 2022 Aug 15;19(9):1417-1429. doi: 10.7150/ijms.73305. eCollection 2022. Int J Med Sci. 2022. PMID: 36035368 Free PMC article.
-
Development and Validation of a Novel Gene Signature for Predicting the Prognosis of Idiopathic Pulmonary Fibrosis Based on Three Epithelial-Mesenchymal Transition and Immune-Related Genes.Front Genet. 2022 Apr 26;13:865052. doi: 10.3389/fgene.2022.865052. eCollection 2022. Front Genet. 2022. PMID: 35559024 Free PMC article.
-
Identification and validation of autophagy-related gene expression for predicting prognosis in patients with idiopathic pulmonary fibrosis.Front Immunol. 2022 Sep 20;13:997138. doi: 10.3389/fimmu.2022.997138. eCollection 2022. Front Immunol. 2022. PMID: 36211385 Free PMC article.
-
Construction and validation of a bronchoalveolar lavage cell-associated gene signature for prognosis prediction in idiopathic pulmonary fibrosis.Int Immunopharmacol. 2021 Mar;92:107369. doi: 10.1016/j.intimp.2021.107369. Epub 2021 Jan 22. Int Immunopharmacol. 2021. PMID: 33493738
-
Establishment and validation of a prognostic model for idiopathic pulmonary fibrosis based on mitochondrial-related genes.J Thorac Dis. 2024 Nov 30;16(11):7427-7445. doi: 10.21037/jtd-24-760. Epub 2024 Nov 14. J Thorac Dis. 2024. PMID: 39678889 Free PMC article.
Cited by
-
Novel Functional Features of cGMP Substrate Proteins IRAG1 and IRAG2.Int J Mol Sci. 2023 Jun 7;24(12):9837. doi: 10.3390/ijms24129837. Int J Mol Sci. 2023. PMID: 37372987 Free PMC article. Review.
-
Identifying a survival-associated cell type based on multi-level transcriptome analysis in idiopathic pulmonary fibrosis.Respir Res. 2024 Mar 15;25(1):126. doi: 10.1186/s12931-024-02738-w. Respir Res. 2024. PMID: 38491375 Free PMC article.
References
-
- Amano H., Mastui Y., Ito Y., Shibata Y., Betto T., Eshima K., et al. (2019). The role of vascular endothelial growth factor receptor 1 tyrosine kinase signaling in bleomycin-induced pulmonary fibrosis. Biomed. Pharmacother. = Biomedecine Pharmacother. 117, 109067. 10.1016/j.biopha.2019.109067 - DOI - PubMed
-
- DeMaio L., Buckley S. T., Krishnaveni M. S., Flodby P., Dubourd M., Banfalvi A., et al. (2012). Ligand-independent transforming growth factor-β type I receptor signalling mediates type I collagen-induced epithelial-mesenchymal transition. J. pathology 226 (4), 633–644. 10.1002/path.3016 - DOI - PMC - PubMed
LinkOut - more resources
Full Text Sources