. 2023 Jan 4:13:1065644.
doi: 10.3389/fgene.2022.1065644. eCollection 2022.

Construction of HBV gene-related prognostic and diagnostic models for hepatocellular carcinoma

Affiliations

Construction of HBV gene-related prognostic and diagnostic models for hepatocellular carcinoma

Keqiang Ma et al. Front Genet. .

Abstract

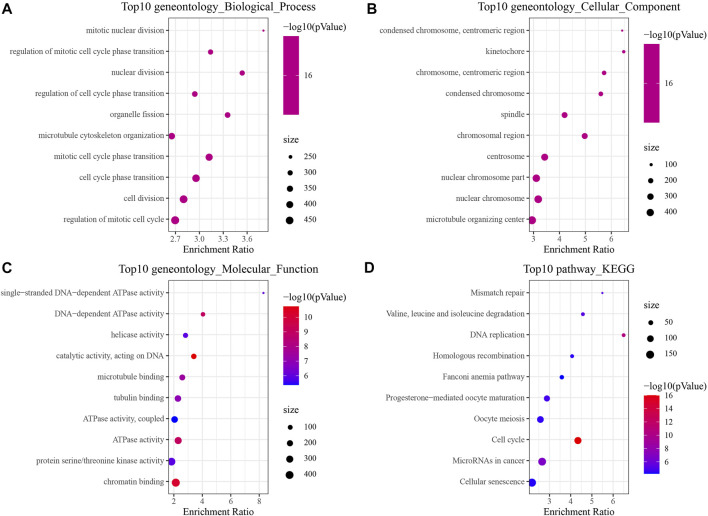
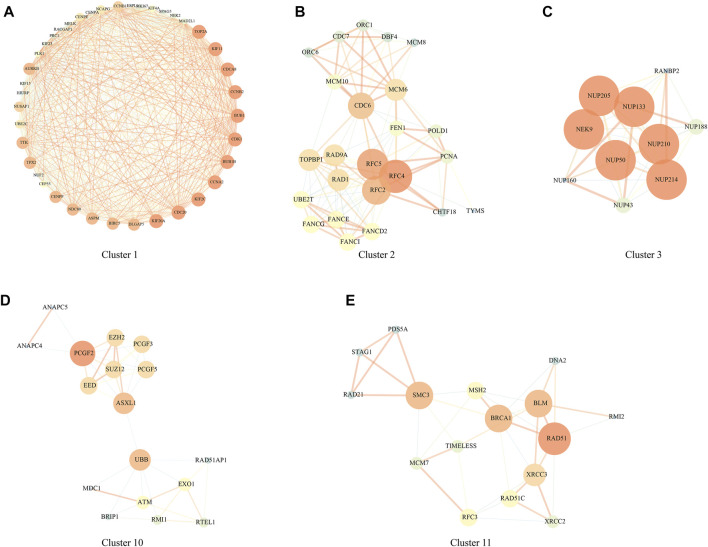
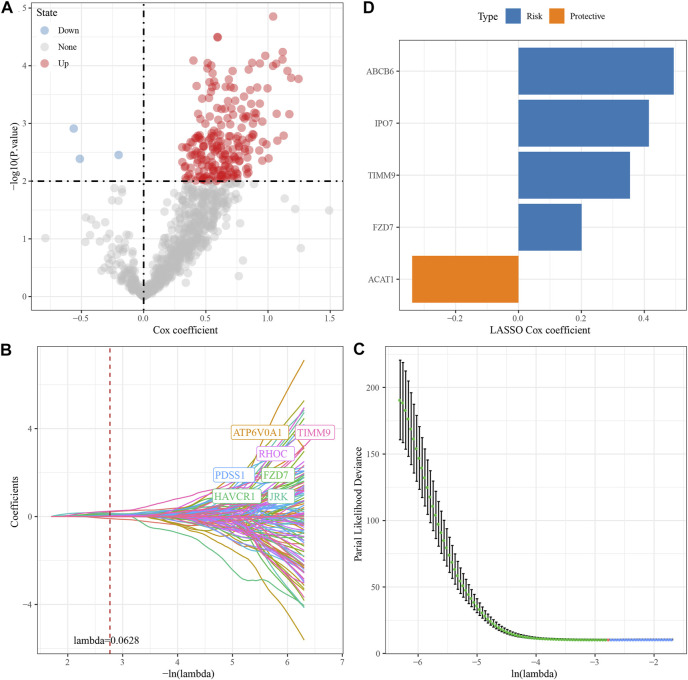
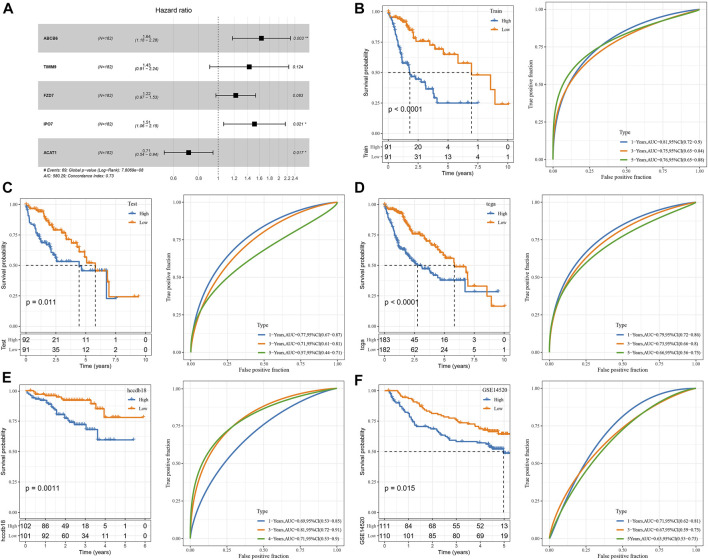
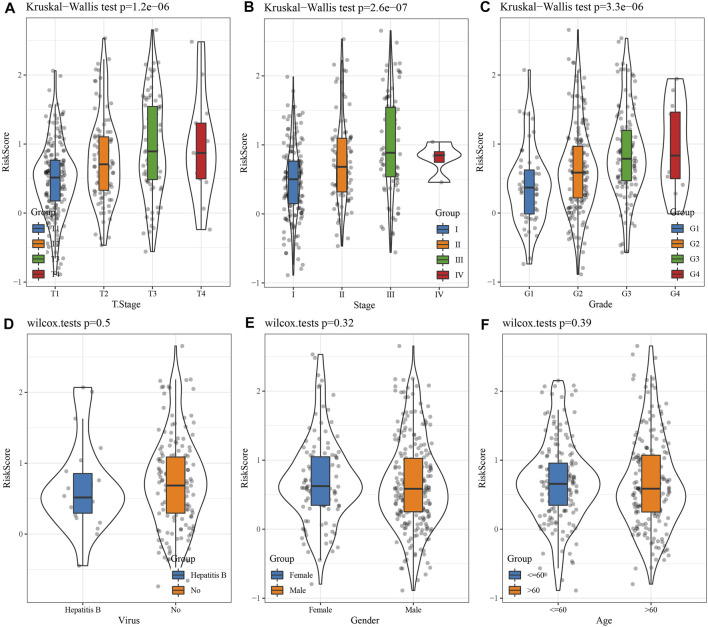
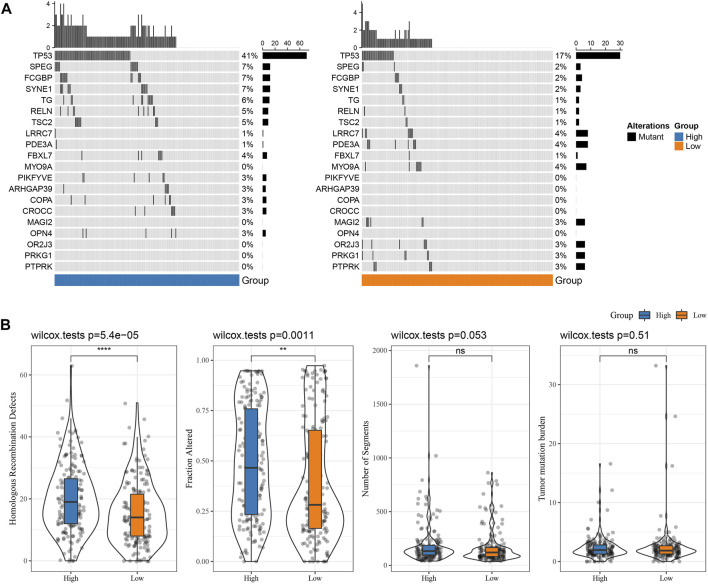
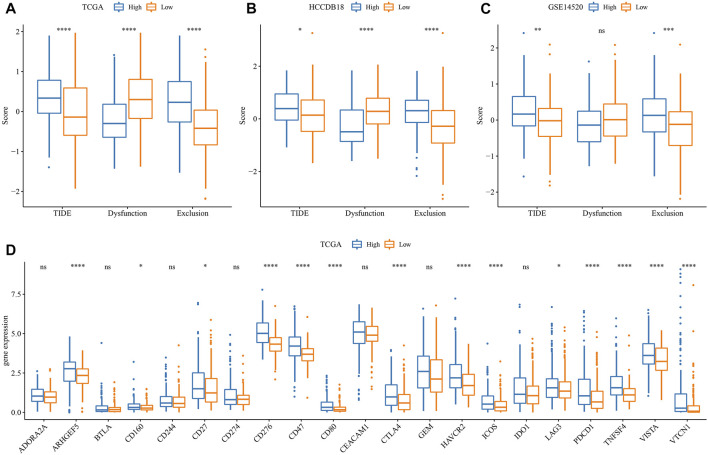
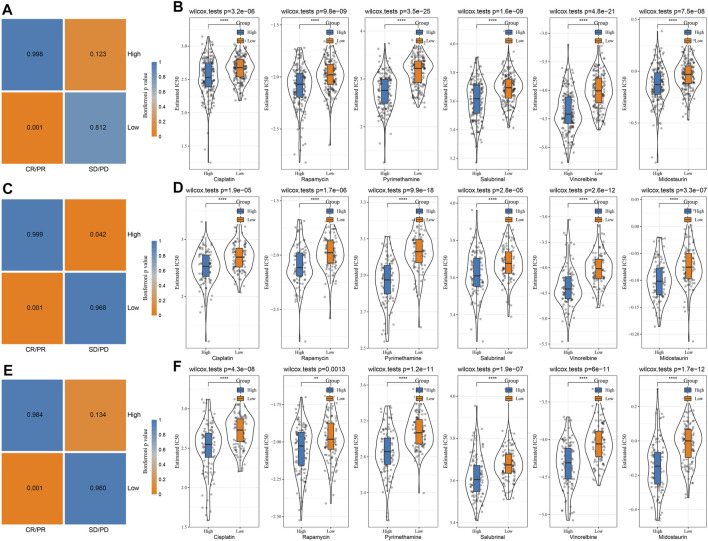
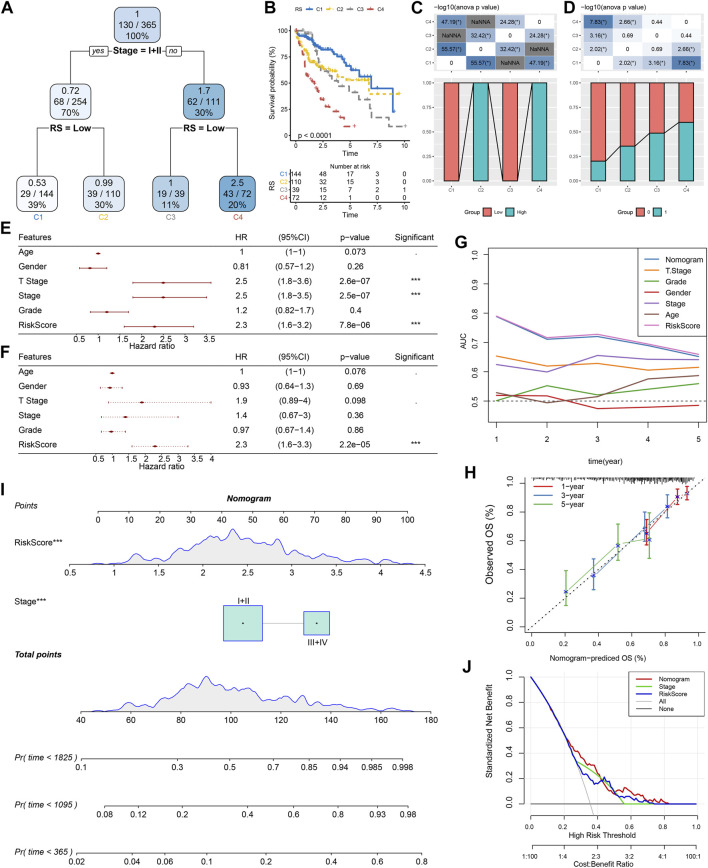
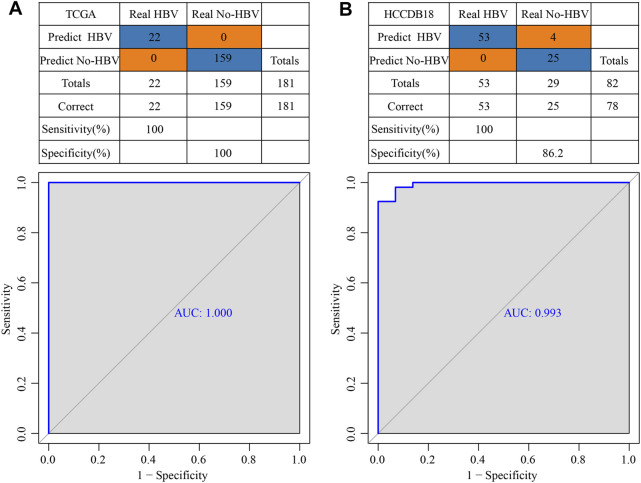
Background: Hepatocellular carcinoma (HCC) is a main cause of malignancy-related death all over the world with a poor prognosis. The current research is focused on developing novel prognostic and diagnostic models of Hepatocellular carcinoma from the perspective of hepatitis B virus (HBV)-related genes, and predicting its prognostic characteristics and potential reliable biomarkers for Hepatocellular carcinoma diagnosis. Methods: As per the information related to Hepatocellular carcinoma expression profile and the clinical data in multiple public databases, we utilized limma for assessing the differentially expressed genes (DEGs) in HBV vs non- hepatitis B virus groups, and the gene set was enriched, analyzed and annotated by WebGestaltR package. Then, STRING was employed to investigate the protein interactions. A risk model for evaluating Hepatocellular carcinoma prognosis was built with Lasso Cox regression analysis. The effect patients receiving immunotherapy was predicted using Tumor Immune Dysfunction and Exclusion (TIDE). Additionally, pRRophetic was used to investigate the drug sensitivity. Lastly, the Support Vector Machine (SVM) approach was utilized for building the diagnostic model. Results: The Hepatocellular Carcinoma Molecular Atlas 18 (HCCDB18) data set was utilized for the identification of 1344 HBV-related differentially expressed genes, mainly associated with cell division activities. Five functional modules were established and then we built a prognostic model in accordance with the protein-protein interaction (PPI) network. Five HBV-related genes affecting prognosis were identified for constructing a prognostic model. Then, the samples were assigned into RS-high and -low groups as per their relevant prognostic risk score (RS). High-risk group showed worse prognosis, higher mutation rate of TP53, lower sensitivity to immunotherapy but higher response to chemotherapeutic drugs than low-risk group. Finally, the hepatitis B virus diagnostic model of Hepatocellular carcinoma was established. Conclusion: In conclusion, the prognostic and diagnostic models of hepatitis B virus gene-related Hepatocellular carcinoma were constructed. ABCB6, IPO7, TIMM9, FZD7, and ACAT1, the five HBV-related genes that affect the prognosis, can work as reliable biomarkers for the diagnosis of Hepatocellular carcinoma, giving a new insight for improving the prognosis, diagnosis, and treatment outcomes of HBV-type Hepatocellular carcinoma.

Keywords: HBV; LIHC; immune microenvironment; molecular subtypes; prognostic characteristics.


Conflict of interest statement

The authors declare that the research was conducted in the absence of any commercial or financial relationships that could be construed as a potential conflict of interest. The reviewer WN declared a shared parent affiliation with the authors KM and HW to the handling editor at the time of the review.

Figures

FIGURE 1
FIGURE 1
The results of functional enrichment analysis of HCCDB18. (A) BP annotation map of DEGs between HBV and non-HBV patients; (B) CC annotation map of DEGs between HBV and non-HBV patients; (C) MF annotation map of DEGs between HBV infected and non-HBV infected patients; (D) KEGG annotation map of DEGs between HBV and non-HBV patients.
FIGURE 2
FIGURE 2
PPI network module results. (A) Cluster one network PPI analysis; (B) Cluster two network PPI analysis; (C) Cluster three network PPI analysis; (D) Cluster 10 network PPI analysis; (E) Cluster 11 network PPI analysis.
FIGURE 3
FIGURE 3
Construction of HBV gene prognostic model for HCC. (A) Analysis results of DEGs; (B) The locus of each independent variable changing with lambda; (C) CI under lambda; (D) Lasso coefficient distribution of HBV-related gene characteristics.
FIGURE 4
FIGURE 4
Construction and validation of the clinical prognostic model. (A) Multivariate Cox forest map of model genes; (B) ROC curve and KM survival curve of RS in TCGA training data cohort; (C) ROC curve and KM survival curve of RS in the TCGA validation data cohort; (D) ROC curve and KM survival curve of RS in TCGA cohort; (E) ROC curve and KM survival curve of RS in HCCDB18 cohort; (F) ROC curve and KM survival curve of RS in GSE14520 cohort.
FIGURE 5
FIGURE 5
Differences in RSs among different clinicopathological groups in the TCGA cohort. (A) T Stage; (B) Stage; (C) Grade; (D) Virus; (E) Gender; (F) Age. (ns, p > 0.05; * * *, p < 0.001; * *, p < 0.01; *, p < 0.05).
FIGURE 6
FIGURE 6
Genome changes of RS groups in TCGA cohort. (A) Somatic mutation analysis of various RS groups in TCGA cohort (fisher’s exact test); (B) Differences in Homologous Recombination Defects, Fraction Altered, Number of Segments, and Tumor mutation burden in different RS groups of TCGA cohort. (ns, p > 0.05; * * *, p < 0.001; * *, p < 0.01; *, p < 0.05).
FIGURE 7
FIGURE 7
Pathway characteristics between RS groups. (A) The correlation analysis results between the KEGG pathway and RS whose correlation with RS in TCGA cohort is greater than 0.35; (B) RS-high and RS-low enrichment fractional heat maps.
FIGURE 8
FIGURE 8
Difference analysis of immunotherapy. (A) Differences in the results of TIDE analysis among different groups in TCGA cohort; (B) Differences in TIDE analysis results among different groups in HCCDB18 queue; (C) Differences in TIDE analysis results among different groups in GSE14520 queue; (D) Immune checkpoints differentially expressed between different groups in the TCGA cohort. (ns, p > 0.05; * * *, p < 0.001; * *, p < 0.01; *, p < 0.05).
FIGURE 9
FIGURE 9
Immunotherapy mapping and drug sensitivity analysis. (A) Immunotherapy mapping of different risk groups of TCGA; (B) Estimated IC50 box diagram of cisplatin, rapamycin, pyrimethamine, salubrinal, vinorelbine, and midostaurin in TCGA; (C) Immunotherapy mapping of different risk groups of HCCDB18; (D) Estimated IC50 box diagram of cisplatin, rapamycin, pyrimethamine, salubrinal, vinorelbine and midostaurin in HCCDB18; (E) Immunotherapy mapping of different risk groups of GSE14520; (F) Estimated IC50 box diagram of cisplatin, rapamycin, pyrimethamine, salubrinal, vinorelbine and midostaurin in GSE14520. (ns, p > 0.05; * * *, p < 0.001; * *, p < 0.01; *, p < 0.05).
FIGURE 10
FIGURE 10
Improvement of a prognostic model and survival prediction. (A) The survival decision tree was constructed by using all annotations of patients, including RS, stage, gender, and age, to optimize risk stratification; (B) Overall survival analysis of three risk subgroups; (C–D): Comparative analysis between different groups; E–F: univariate and multivariate Cox analysis of RS and clinicopathological characteristics; (G) Nomograph model; (H) Calibration curve of nomograph in 1, 3 and 5 years; (I) ROC curves of different clinicopathological characteristics at different times; (J) Decision curve of nomograph.
FIGURE 11
FIGURE 11
Construction of a diagnostic model of HBV gene in HCC. (A) The classification outcomes and ROC curves of samples in TCGA by diagnostic model; (B) The classification outcomes and ROC curves of samples in HCCDB18 samples by diagnostic model.

Similar articles

Cited by

References

    1. Ayub A., Ashfaq U. A., Haque A. (2013). HBV induced HCC: Major risk factors from genetic to molecular level. BioMed Res. Int. 2013, 810461. 10.1155/2013/810461 - DOI - PMC - PubMed
    1. Bi Y., Yin B., Fan G. (2021). Identification of metabolism genes related to hepatocarcinogenesis and progression in type 2 diabetes mellitus via co-expression networks analysis. Hereditas 158 (1), 14. 10.1186/s41065-021-00177-x - DOI - PMC - PubMed
    1. Blanche P., Dartigues J. F., Jacqmin-Gadda H. (2013). Estimating and comparing time-dependent areas under receiver operating characteristic curves for censored event times with competing risks. Statistics Med. 32 (30), 5381–5397. 10.1002/sim.5958 - DOI - PubMed
    1. Bray F., Ferlay J., Soerjomataram I., Siegel R. L., Torre L. A., Jemal A. (2018). Global cancer statistics 2018: GLOBOCAN estimates of incidence and mortality worldwide for 36 cancers in 185 countries. CA a cancer J. Clin. 68 (6), 394–424. 10.3322/caac.21492 - DOI - PubMed
    1. Chen Y., Xu Y., Zhao M., Liu Y., Gong M., Xie C., et al. (2016). High-throughput T cell receptor sequencing reveals distinct repertoires between tumor and adjacent non-tumor tissues in HBV-associated HCC. Oncoimmunology 5 (10), e1219010. 10.1080/2162402X.2016.1219010 - DOI - PMC - PubMed