. 2023 Jan 6:13:1077615.
doi: 10.3389/fgene.2022.1077615. eCollection 2022.

Transcriptome and pan-cancer system analysis identify PM2.5-induced stanniocalcin 2 as a potential prognostic and immunological biomarker for cancers

Affiliations

Transcriptome and pan-cancer system analysis identify PM2.5-induced stanniocalcin 2 as a potential prognostic and immunological biomarker for cancers

Dong Zhu et al. Front Genet. .

Abstract

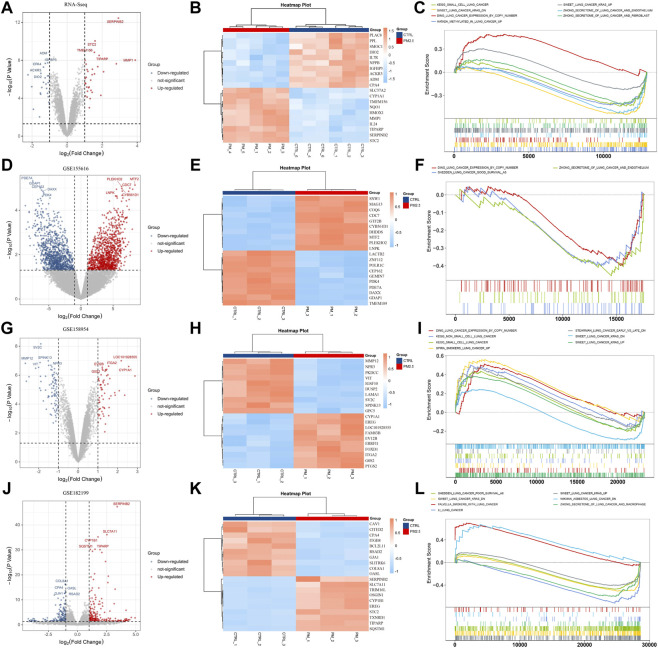
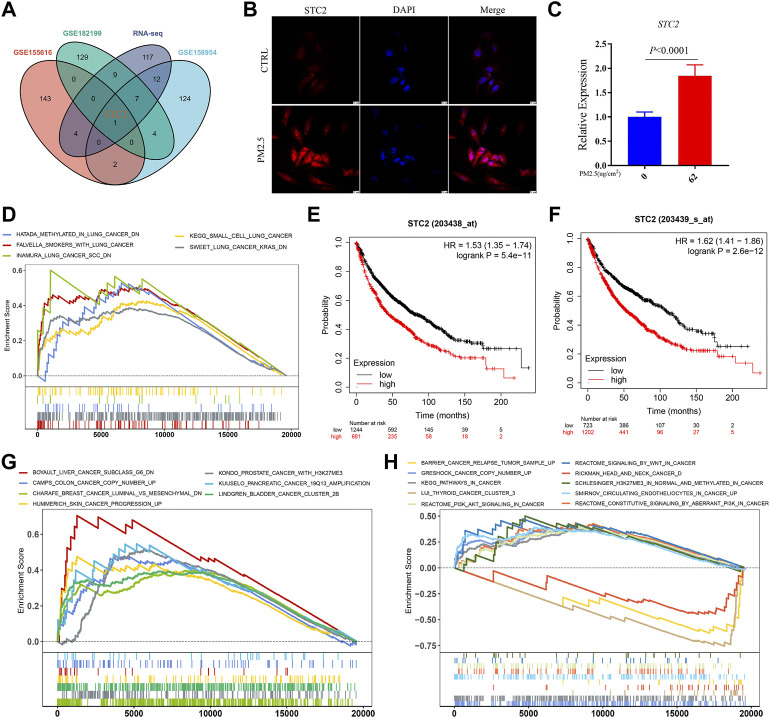
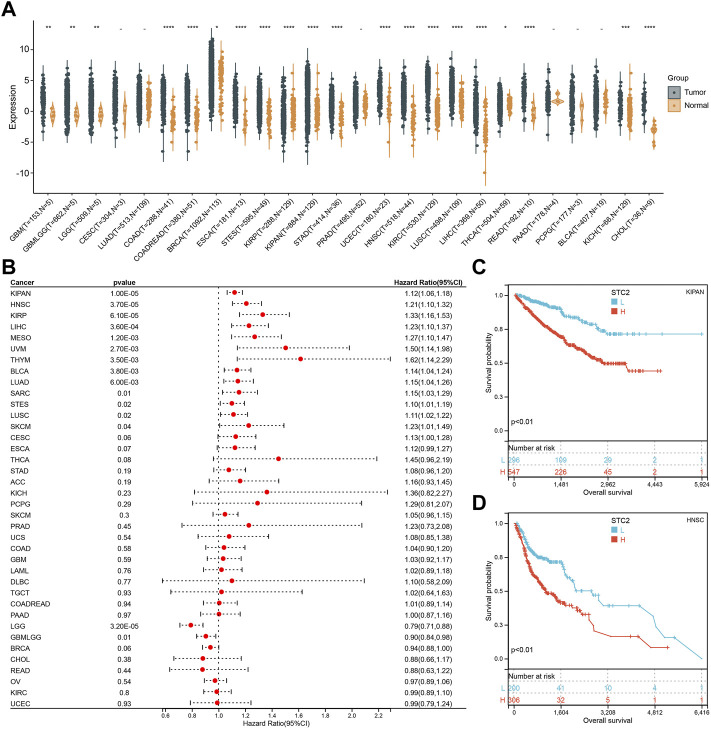
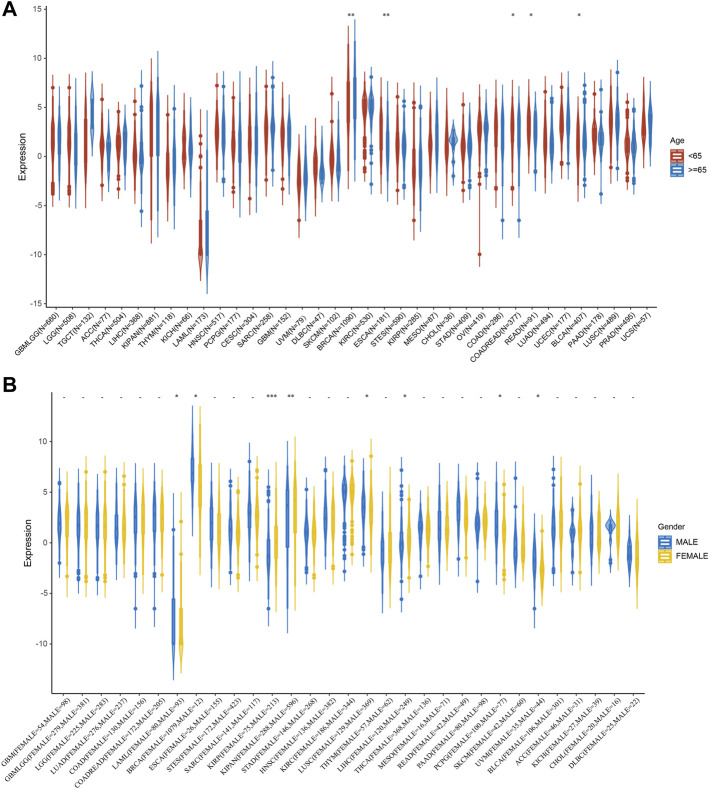
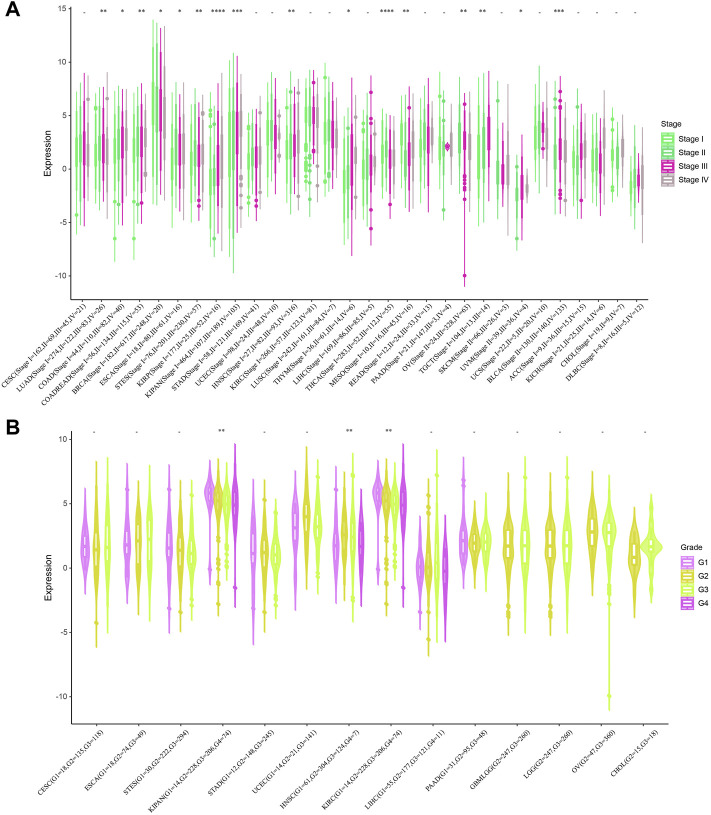
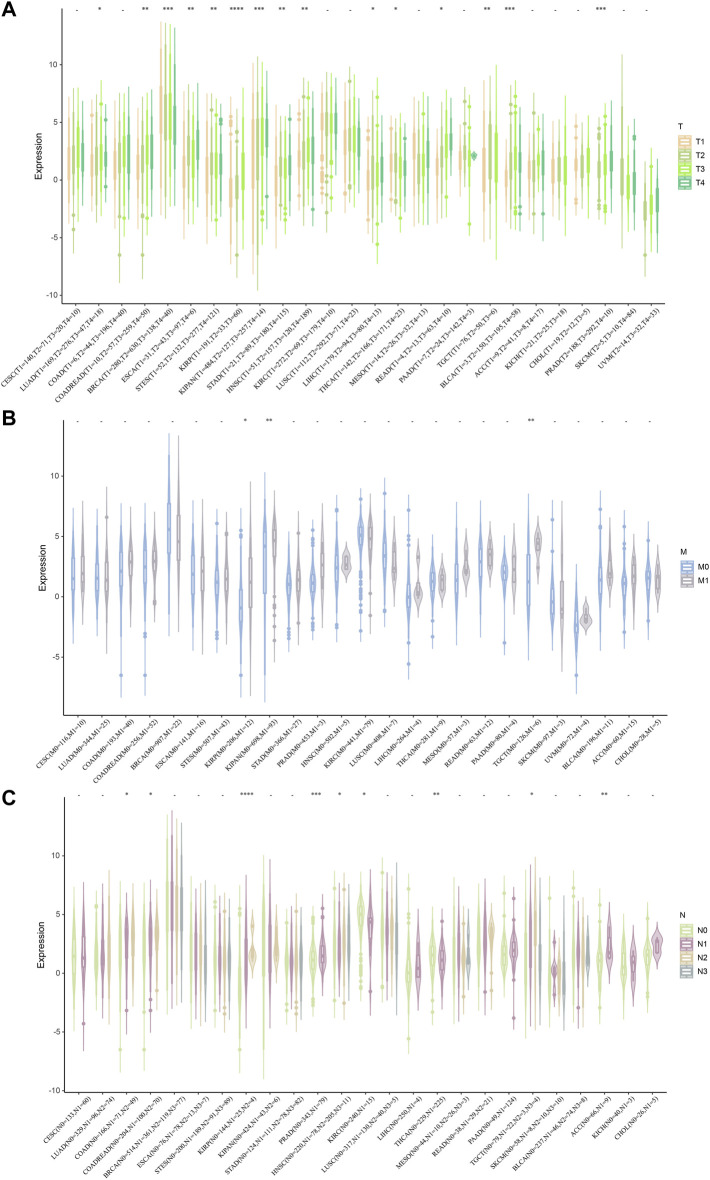
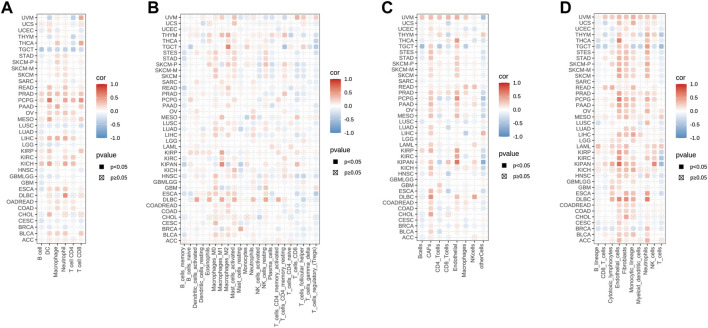
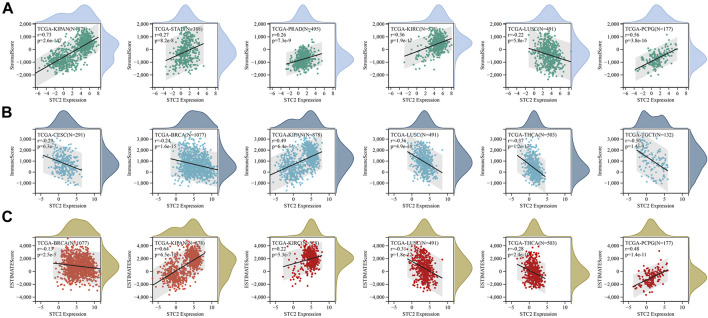
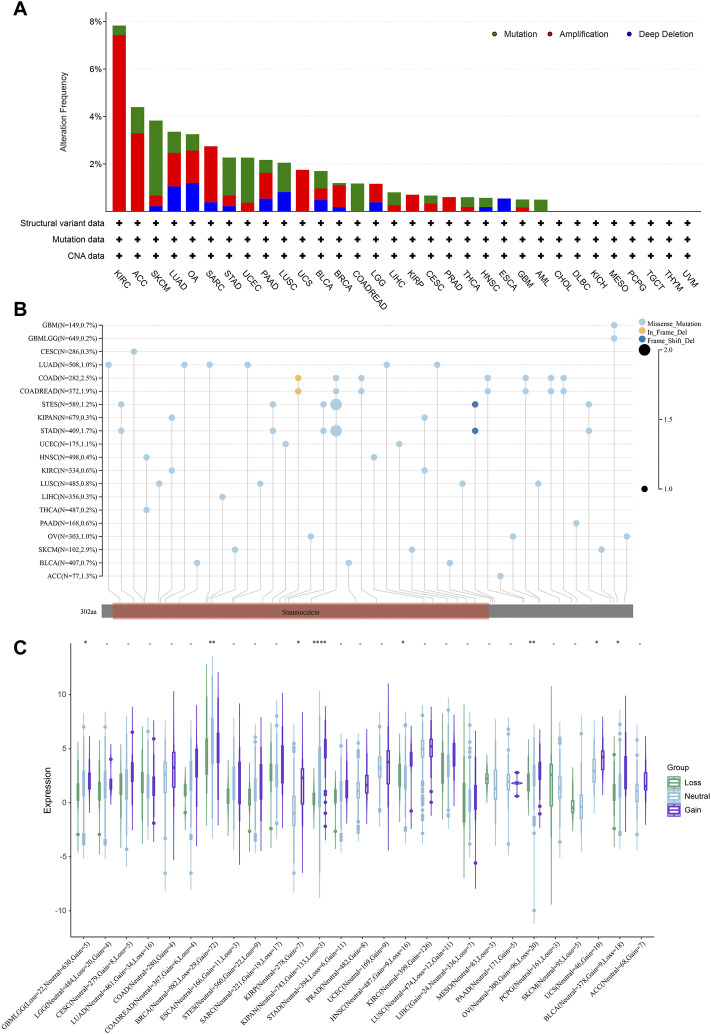
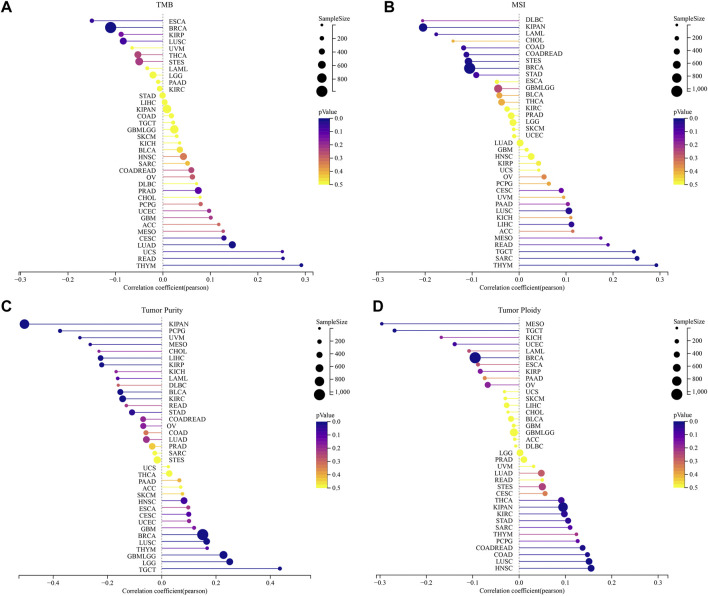
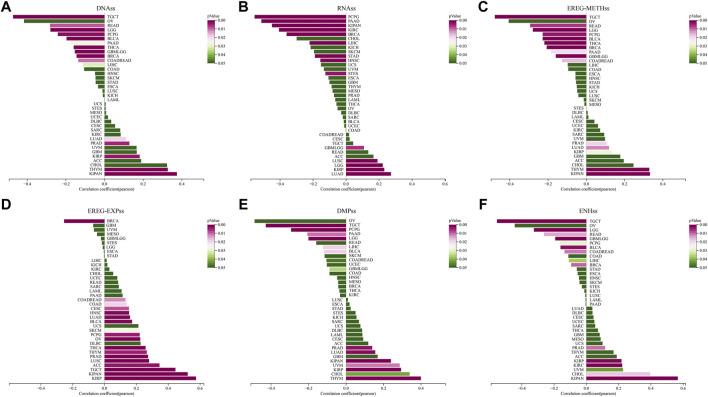
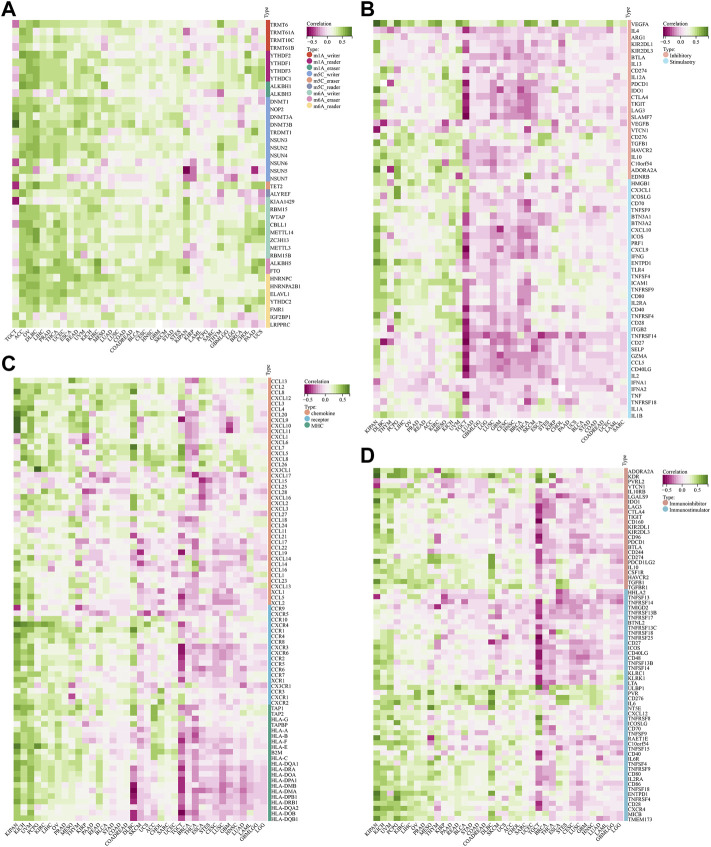
Epidemiological studies have shown that air pollution and particulate matter (PM) are closely related to the occurrence of cancer. However, the potential prognostic and immunological biomarkers for air pollution related cancers are lacking. In this study, we proved PM2.5 exposure was correlated with lung cancer through transcriptome analysis. Importantly, we identified STC2 as a key gene regulated by PM2.5, whose expression in epithelial cells was significantly increased after PM2.5 treatment and validated by using RT-qPCR and immunofluorescence. Kaplan-Meier OS curves suggested that high STC2 expression positively correlated with a poor prognosis in lung cancer. Furthermore, we discovered that STC2 was associated with multiple cancers and pathways in cancer. Next, Pan-Cancer Expression Landscape of STC2 showed that STC2 exhibited inconsistent expression across 26 types of human cancer, lower in KIRP in cancer versus adjacent normal tissues, and significantly higher in another cancers. Cox regression results suggested that STC2 expression was positively or negatively associated with prognosis in different cancers. Moreover, STC2 expression was associated with clinical phenotypes including age, gender, stage and grade. Mutation features of STC2 were also analyzed, in which the highest alteration frequency of STC2 was presented in KIRC with amplification. Meanwhile, the effects of copy number variation (CNV) on STC2 expression were investigated across various tumor types, suggesting that STC2 expression was significantly correlated with CNV in tumors. Additionally, STC2 was closely related to tumor heterogeneity, tumor stemness and tumor immune microenvironment like immune cell infiltration. In the meantime, we analyzed methylation modifications and immunological correlation of STC2. The results demonstrated that STC2 expression positively correlated with most RNA methylation genes and immunomodulators across tumors. Taken together, the findings revealed that PM2.5-induced STC2 might be a potential prognostic and immunological biomarker for cancers related to air pollution.

Keywords: PM2.5; biomarker; cancer; prognosis; stanniocalcin 2 (STC2).


Conflict of interest statement

The authors declare that the research was conducted in the absence of any commercial or financial relationships that could be construed as a potential conflict of interest.

Figures

FIGURE 1
FIGURE 1
PM2.5 exposure is associated with lung cancer. (A,D,G,J) Volcano plots showing DEGs from our own RNA-seq data and public datasets (GSE155616, GSE158954, and GSE 128199); (B,E,H,K) Heatmaps showing top 10 DEGs. (C,F,I,L) GSEA analysis showing PM2.5 exposure was associated with lung cancer.
FIGURE 2
FIGURE 2
STC2 is a key gene regulated by PM2.5 and associated with multiple cancers. (A) Venn plot showing PM2.5 induced STC2 in different gene sets; (B) Immunofluorescence imaging showing the expression level of STC2 in different group; (C) qPCR showing the relative expression of STC2 in different group; (D) GSEA analysis showing high STC2 expression associated with lung cancer; (E,F) Kaplan-Meier OS curves showing high STC2 expression positively correlated with a poor prognosis in lung cancer; (G,H) STC2 expression was associated with a variety of cancers.
FIGURE 3
FIGURE 3
Pan-Cancer Expression Landscape of STC2. (A) STC2 expression across 26 types of human cancer; (B) Cox regression showing the correlation between STC2 expression and OS; (C,D) Two presentative Kaplan-Meier OS curves (KIPAN and HNSC). *: p-value < 0.05; **: p-value < 0.01, ***: p-value < 0.001, ****: p-value < 0.0001.
FIGURE 4
FIGURE 4
Correlation between STC2 Expression and Clinical phenotypes. (A) The relationship between STC2 expression and age; (B) The relationship between STC2 expression and gender. *: p-value < 0.05; **: p-value < 0.01, ***: p-value < 0.001.
FIGURE 5
FIGURE 5
Correlation between STC2 Expression and Clinical phenotypes. (A) The relationship between STC2 expression and Stage; (B) The relationship between STC2 expression and Grade. *: p-value < 0.05; **: p-value < 0.01, ***: p-value < 0.001, ****: p-value < 0.0001.
FIGURE 6
FIGURE 6
Correlation between STC2 Expression and Clinical phenotypes. (A–C) The relationship between STC2 expression and TMN staging. *: p-value < 0.05; **: p-value < 0.01, ***: p-value < 0.001, ****: p-value < 0.0001.
FIGURE 7
FIGURE 7
STC2 expression correlated with immune infiltration. (A) TIMER analysis showing the correlation between STC2 expression and immune cells infiltration; (B) CIBERSORT showing the correlation between STC2 expression and immune cells infiltration; (C) EPIC showing the correlation between STC2 expression and immune cells infiltration; (D) MCPcounter showing the correlation between STC2 expression and immune cells infiltration.
FIGURE 8
FIGURE 8
STC2 expression correlated with immune infiltration. (A) Correlation between STC2 expression and stromal score in six cancer types; (B) Correlation between STC2 expression and immune score in six cancer types; (C) Correlation between STC2 expression and estimate score in six cancer types.
FIGURE 9
FIGURE 9
Mutation features of STC2. (A) Mutation features of STC2 in different tumor samples; (B) The types, sites and case percentage of STC2 genetic alteration; (C) The effects of copy number variation (CNV) on STC2 expression. *: p-value < 0.05; **: p-value < 0.01, ****: p-value < 0.0001.
FIGURE 10
FIGURE 10
Correlation between the STC2 Expression and tumor heterogeneity. (A) Correlations between STC2 expression and TMB; (B) Correlations between STC2 expression and MSI; (C) Correlations between STC2 expression and tumor purity; (D) Correlations between STC2 expression and ploidy.
FIGURE 11
FIGURE 11
Correlation between STC2 expression and tumor stemness. (A–F) Relationship between STC2 expression and DNAss, RNAss, EREG-METHss, EREG-EXPss, DMPss and ENHss.
FIGURE 12
FIGURE 12
Correlation between STC2 expression and RNA methylation modifications. (A) Relationship between the expression of STC2 and three types of RNA methylation modifications; (B) Relationship between STC2 and immune checkpoints genes; (C,D) Immunological correlation of STC2.

Similar articles

Cited by

  • Epigenetic mechanisms of particulate matter exposure: air pollution and hazards on human health.
    Gavito-Covarrubias D, Ramírez-Díaz I, Guzmán-Linares J, Limón ID, Manuel-Sánchez DM, Molina-Herrera A, Coral-García MÁ, Anastasio E, Anaya-Hernández A, López-Salazar P, Juárez-Díaz G, Martínez-Juárez J, Torres-Jácome J, Albarado-Ibáñez A, Martínez-Laguna Y, Morán C, Rubio K. Gavito-Covarrubias D, et al. Front Genet. 2024 Jan 17;14:1306600. doi: 10.3389/fgene.2023.1306600. eCollection 2023. Front Genet. 2024. PMID: 38299096 Free PMC article. Review.
  • Copy Number Variation in Asthma: An Integrative Review.
    Garcia FM, de Sousa VP, Silva-Dos-Santos PPE, Fernandes IS, Serpa FS, de Paula F, Mill JG, Bueno MRP, Errera FIV. Garcia FM, et al. Clin Rev Allergy Immunol. 2025 Jan 4;68(1):4. doi: 10.1007/s12016-024-09015-0. Clin Rev Allergy Immunol. 2025. PMID: 39755867 Review.

References

    1. Bai K., He S., Shu L., Wang W., Lin S., Zhang Q., et al. (2020). Identification of cancer stem cell characteristics in liver hepatocellular carcinoma by WGCNA analysis of transcriptome stemness index. Cancer Med. 9 (12), 4290–4298. 10.1002/cam4.3047 - DOI - PMC - PubMed
    1. Bajrai L., Sohrab S., Mobashir M., Kamal M., Rizvi M., Azhar E. (2021). Understanding the role of potential pathways and its components including hypoxia and immune system in case of oral cancer. Sci. Rep. 11 (1), 19576. 10.1038/s41598-021-98031-7 - DOI - PMC - PubMed
    1. Bo Y., Yu T., Chang L., Guo C., Lin C., Zeng Y., et al. (2022). Combined effects of chronic PM2.5 exposure and habitual exercise on cancer mortality: A longitudinal cohort study. Int. J. Epidemiol. 51 (1), 225–236. 10.1093/ije/dyab209 - DOI - PubMed
    1. Bonneville R., Krook M., Kautto E., Miya J., Wing M., Chen H., et al. (2017). Landscape of microsatellite instability across 39 cancer types. JCO Precis. Oncol. 2017, 1–15. 10.1200/PO.17.00073 - DOI - PMC - PubMed
    1. Cao J., Yang X., Chen S., Wang J., Fan X., Fu S., et al. (2022). The predictive efficacy of tumor mutation burden in immunotherapy across multiple cancer types: A meta-analysis and bioinformatics analysis. Transl. Oncol. 20, 101375. 10.1016/j.tranon.2022.101375 - DOI - PMC - PubMed

LinkOut - more resources