

Whole-genome resequencing reveals genetic diversity and selection characteristics of dairy goat
- PMID: 36685859
- PMCID: PMC9852865
- DOI: 10.3389/fgene.2022.1044017
Whole-genome resequencing reveals genetic diversity and selection characteristics of dairy goat
Abstract
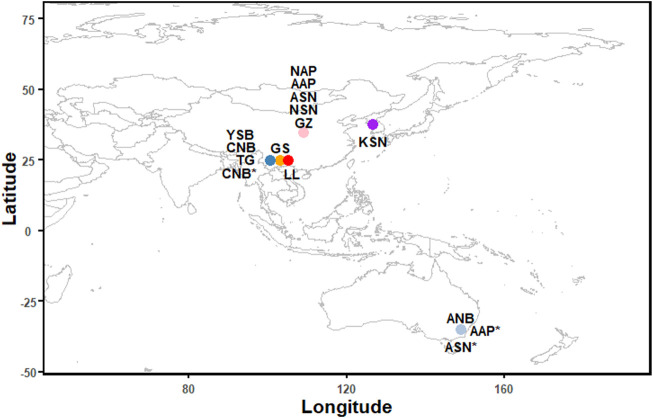
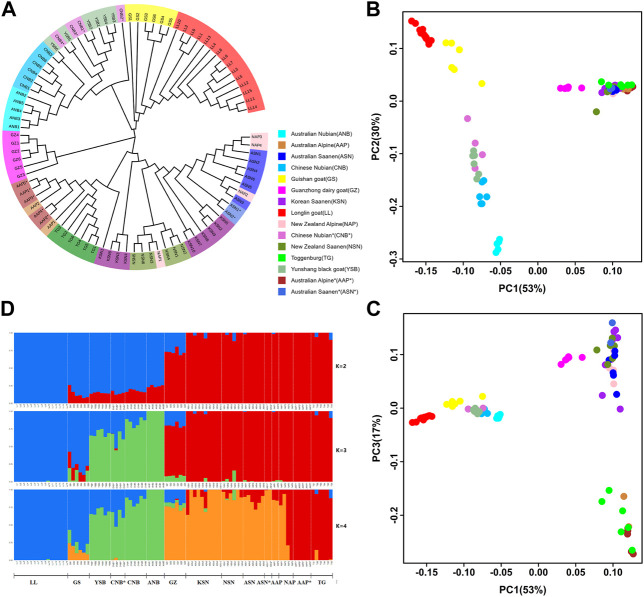
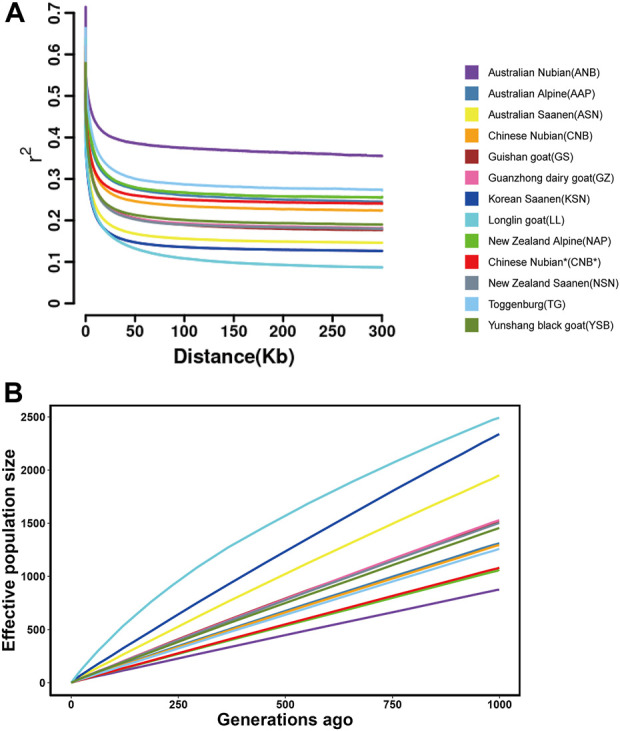
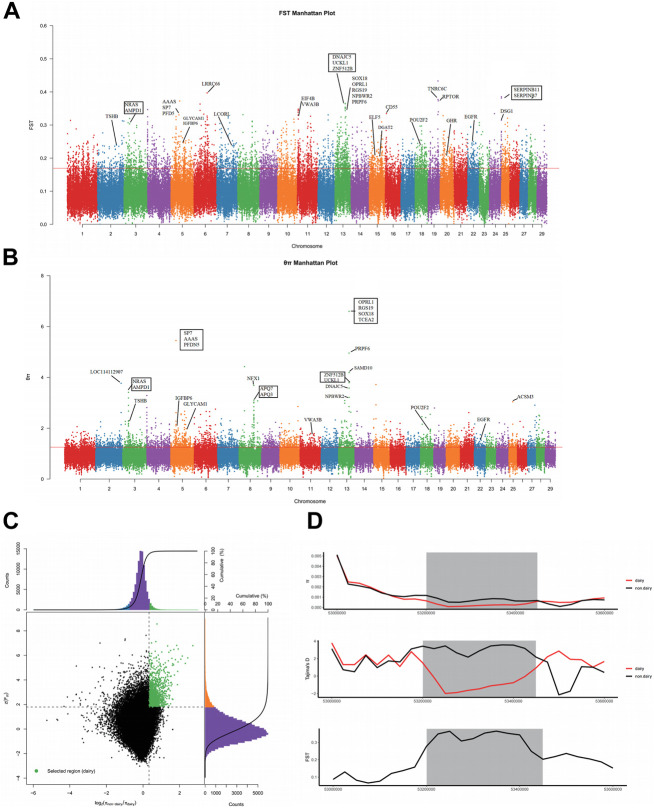
The dairy goat is one of the earliest dairy livestock species, which plays an important role in the economic development, especially for developing countries. With the development of agricultural civilization, dairy goats have been widely distributed across the world. However, few studies have been conducted on the specific characteristics of dairy goat. In this study, we collected the whole-genome data of 89 goat individuals by sequencing 48 goats and employing 41 publicly available goats, including five dairy goat breeds (Saanen, Nubian, Alpine, Toggenburg, and Guanzhong dairy goat; n = 24, 15, 11, 6, 6), and three goat breeds (Guishan goat, Longlin goat, Yunshang Black goat; n = 6, 15, 6). Through compared the genomes of dairy goat and non-dairy goat to analyze genetic diversity and selection characteristics of dairy goat. The results show that the eight goats could be divided into three subgroups of European, African, and Chinese indigenous goat populations, and we also found that Australian Nubian, Toggenburg, and Australian Alpine had the highest linkage disequilibrium, the lowest level of nucleotide diversity, and a higher inbreeding coefficient, indicating that they were strongly artificially selected. In addition, we identified several candidate genes related to the specificity of dairy goat, particularly genes associated with milk production traits (GHR, DGAT2, ELF5, GLYCAM1, ACSBG2, ACSS2), reproduction traits (TSHR, TSHB, PTGS2, ESR2), immunity traits (JAK1, POU2F2, LRRC66). Our results provide not only insights into the evolutionary history and breed characteristics of dairy goat, but also valuable information for the implementation and improvement of dairy goat cross breeding program.
Keywords: dairy goat; genetic diversity; milk production traits; population structure; selective signal.
Copyright © 2023 Xiong, Bao, Hu, Shang and Zhang.
Conflict of interest statement
The authors declare that the research was conducted in the absence of any commercial or financial relationships that could be construed as a potential conflict of interest.
Figures
References
-
- Adams H. A., Sonstegard T. S., VanRaden P. M., Null D. J., Van Tassell C. P., Larkin D. M., et al. (2016). Identification of a nonsense mutation in APAF1 that is likely causal for a decrease in reproductive efficiency in Holstein dairy cattle. J. Dairy Sci. 99 (8), 6693–6701. 10.3168/jds.2015-10517 - DOI - PubMed
-
- An X. P., Song S. G., Hou J. X., Zhu C. M., Peng J. X., Liu X. Q., et al. (2011). Polymorphism identification in goat DGAT2 gene and association analysis with milk yield and fat percentage. Small Ruminant Res. 100 (2-3), 107–112. 10.1016/j.smallrumres.2011.05.017 - DOI
LinkOut - more resources
Full Text Sources
Other Literature Sources
Research Materials
Miscellaneous