

Exploration of comorbidity mechanisms and potential therapeutic targets of rheumatoid arthritis and pigmented villonodular synovitis using machine learning and bioinformatics analysis
- PMID: 36685864
- PMCID: PMC9853060
- DOI: 10.3389/fgene.2022.1095058
Exploration of comorbidity mechanisms and potential therapeutic targets of rheumatoid arthritis and pigmented villonodular synovitis using machine learning and bioinformatics analysis
Abstract
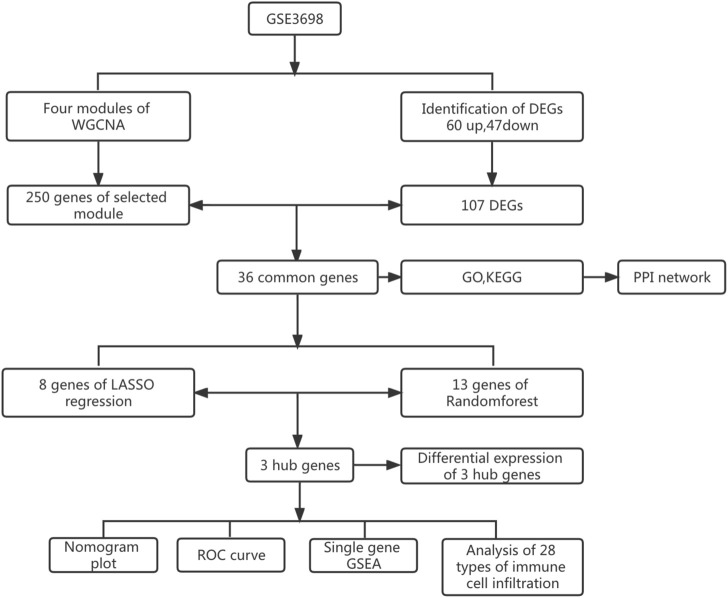
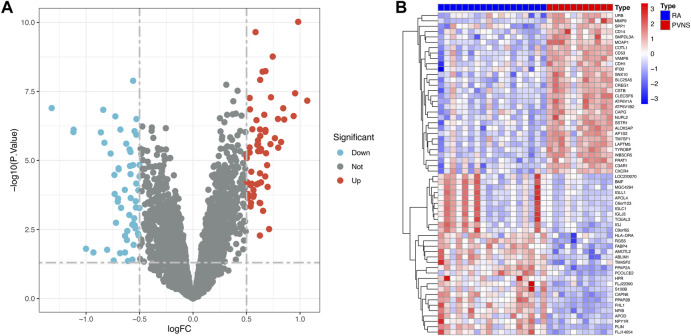
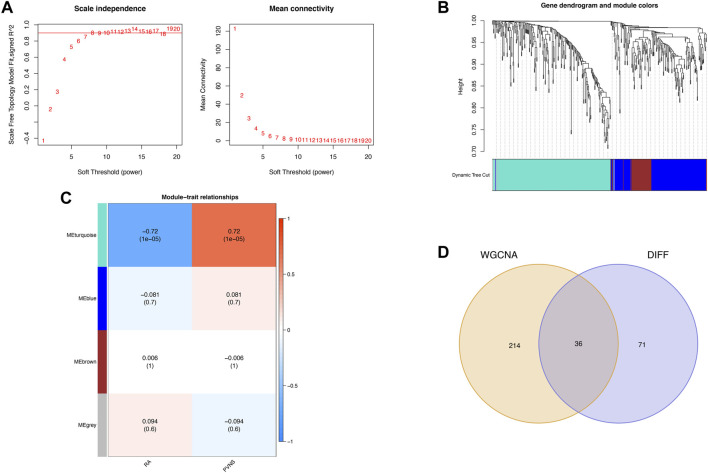
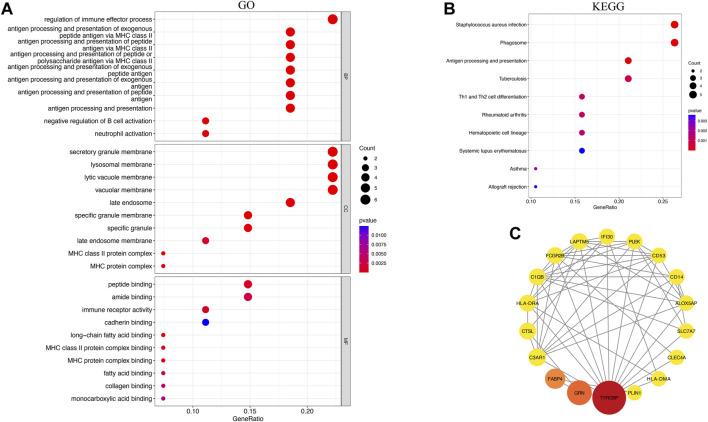
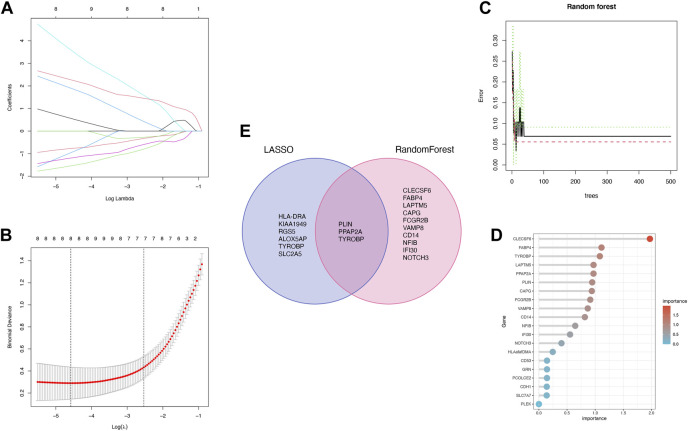
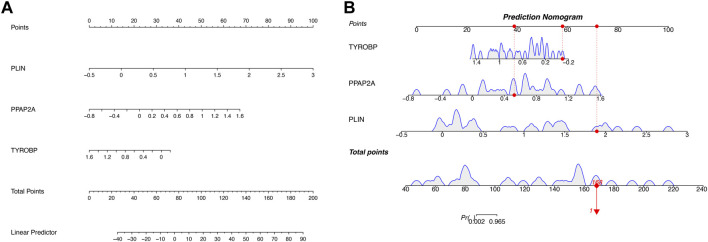
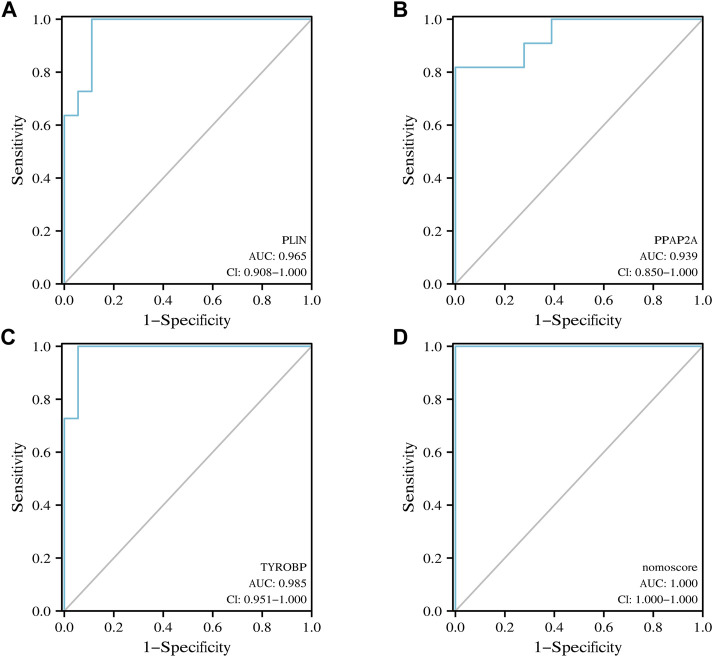
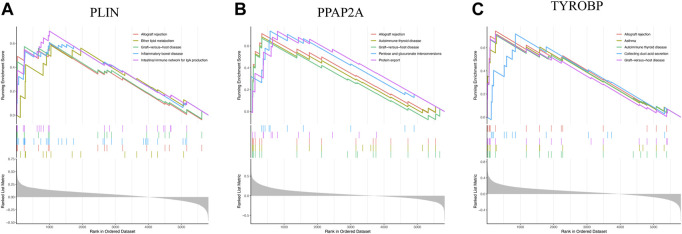
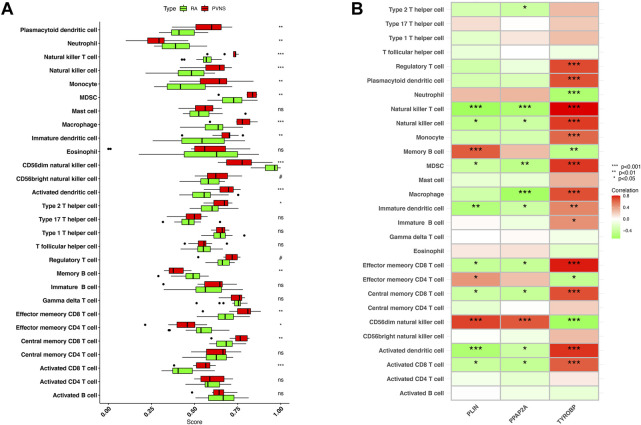
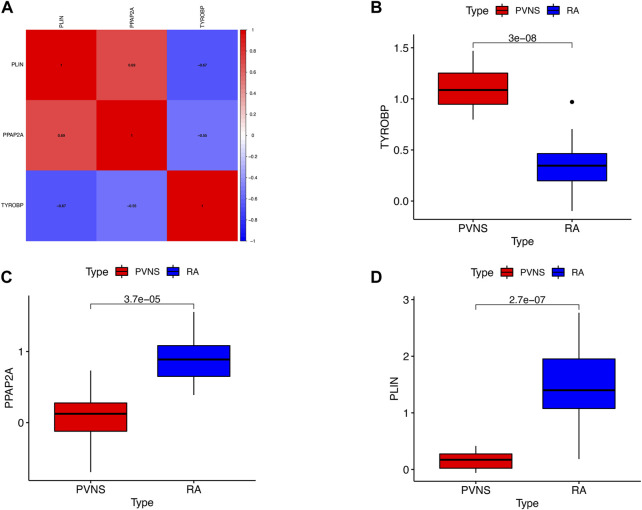
Background: Rheumatoid arthritis (RA) is a chronic autoimmune disease. Pigmented villonodular synovitis (PVNS) is a tenosynovial giant cell tumor that can involve joints. The mechanisms of co-morbidity between the two diseases have not been thoroughly explored. Therefore, this study focused on investigating the functions, immunological differences, and potential therapeutic targets of common genes between RA and PVNS. Methods: Through the dataset GSE3698 obtained from the Gene Expression Omnibus (GEO) database, the differentially expressed genes (DEGs) were screened by R software, and weighted gene coexpression network analysis (WGCNA) was performed to discover the modules most relevant to the clinical features. The common genes between the two diseases were identified. The molecular functions and biological processes of the common genes were analyzed. The protein-protein interaction (PPI) network was constructed using the STRING database, and the results were visualized in Cytoscape software. Two machine learning algorithms, least absolute shrinkage and selection operator (LASSO) logistic regression and random forest (RF) were utilized to identify hub genes and predict the diagnostic efficiency of hub genes as well as the correlation between immune infiltrating cells. Results: We obtained a total of 107 DEGs, a module (containing 250 genes) with the highest correlation with clinical characteristics, and 36 common genes after taking the intersection. Moreover, using two machine learning algorithms, we identified three hub genes (PLIN, PPAP2A, and TYROBP) between RA and PVNS and demonstrated good diagnostic performance using ROC curve and nomogram plots. Single sample Gene Set Enrichment Analysis (ssGSEA) was used to analyze the biological functions in which three genes were mostly engaged. Finally, three hub genes showed a substantial association with 28 immune infiltrating cells. Conclusion: PLIN, PPAP2A, and TYROBP may influence RA and PVNS by modulating immunity and contribute to the diagnosis and therapy of the two diseases.
Keywords: hub gene; immune cell infiltration; machine learning; pigmented villonodular synovitis; rheumatoid arthritis; weighted gene co-expression network analysis.
Copyright © 2023 Heng, Li, Su, Liu, Yu, Bian and Li.
Conflict of interest statement
The authors declare that the research was conducted in the absence of any commercial or financial relationships that could be construed as a potential conflict of interest.
Figures
Similar articles
-
Screening and identification of potential hub genes and immune cell infiltration in the synovial tissue of rheumatoid arthritis by bioinformatic approach.Heliyon. 2023 Jan 10;9(1):e12799. doi: 10.1016/j.heliyon.2023.e12799. eCollection 2023 Jan. Heliyon. 2023. PMID: 36699262 Free PMC article.
-
Identification of immune-related genes in diagnosing atherosclerosis with rheumatoid arthritis through bioinformatics analysis and machine learning.Front Immunol. 2023 Mar 9;14:1126647. doi: 10.3389/fimmu.2023.1126647. eCollection 2023. Front Immunol. 2023. PMID: 36969166 Free PMC article.
-
Identification of diagnostic genes and drug prediction in metabolic syndrome-associated rheumatoid arthritis by integrated bioinformatics analysis, machine learning, and molecular docking.Front Immunol. 2024 Jul 29;15:1431452. doi: 10.3389/fimmu.2024.1431452. eCollection 2024. Front Immunol. 2024. PMID: 39139563 Free PMC article.
-
Immune Cell Infiltration Characteristics of Pigmented Villous Nodular Synovitis and Prediction of Potential Diagnostic Markers Based on Bioinformatics.Biomed Res Int. 2022 Jun 7;2022:8708692. doi: 10.1155/2022/8708692. eCollection 2022. Biomed Res Int. 2022. PMID: 35711523 Free PMC article.
-
Identification of biomarkers associated with pediatric asthma using machine learning algorithms: A review.Medicine (Baltimore). 2023 Nov 24;102(47):e36070. doi: 10.1097/MD.0000000000036070. Medicine (Baltimore). 2023. PMID: 38013370 Free PMC article. Review.
Cited by
-
A Review of Connecting Bioinformatic Techniques to Rheumatoid Arthritis and its Associated Comorbidities.Curr Rheumatol Rev. 2025;21(1):25-36. doi: 10.2174/0115733971302188240515075547. Curr Rheumatol Rev. 2025. PMID: 38803169 Review.
References
-
- Abdul-Karim F. W., el-Naggar A. K., Joyce M. J., Makley J. T., Carter J. R. (1992). Diffuse and localized tenosynovial giant cell tumor and pigmented villonodular synovitis: A clinicopathologic and flow cytometric DNA analysis. Hum. Pathol. 23 (7), 729–735. 10.1016/0046-8177(92)90340-9 - DOI - PubMed
-
- Aigner T., Oehler S., Niedobitek H. G., Fassbender G., Kirchner T. (1998). Iron deposits, cell populations and proliferative activity in pigmented villonodular synovitis of the knee joint. Verh. Dtsch. Ges. Pathol. 82, 327–331. - PubMed
-
- Berger I., Weckauf H., Helmchen B., Ehemann V., Penzel R., Fink B., et al. (2005). Rheumatoid arthritis and pigmented villonodular synovitis: Comparative analysis of cell polyploidy, cell cycle phases and expression of macrophage and fibroblast markers in proliferating synovial cells. Histopathology 46 (5), 490–497. 10.1111/j.1365-2559.2005.01959.x - DOI - PubMed
LinkOut - more resources
Full Text Sources