Identification of oxidative stress-related genes and potential mechanisms in atherosclerosis
- PMID: 36685865
- PMCID: PMC9845256
- DOI: 10.3389/fgene.2022.998954
Identification of oxidative stress-related genes and potential mechanisms in atherosclerosis
Abstract
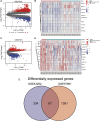
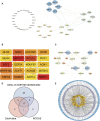
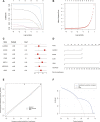
Atherosclerosis (AS) is the main cause of death in individuals with cardiovascular and cerebrovascular diseases. A growing body of evidence suggests that oxidative stress plays an essential role in Atherosclerosis pathology. The aim of this study was to determine genetic mechanisms associated with Atherosclerosis and oxidative stress, as well as to construct a diagnostic model and to investigate its immune microenvironment. Seventeen oxidative stress-related genes were identified. A four-gene diagnostic model was constructed using the least absolute shrinkage and selection operator (LASSO) algorithm based on these 17 genes. The area under the Receiver Operating Characteristic (ROC) curve (AUC) was 0.967. Based on the GO analysis, cell-substrate adherens junction and focal adhesion were the most enriched terms. KEGG analysis revealed that these overlapping genes were enriched in pathways associated with Alzheimer's disease and Parkinson's disease, as well as with prion disease pathways and ribosomes. Immune cell infiltration correlation analysis showed that the immune cells with significant differences were CD4 memory activated T cells and follicular helper T cells in the GSE43292 dataset and CD4 naïve T cells and CD4 memory resting T cells in the GSE57691 dataset. We identified 17 hub genes that were closely associated with oxidative stress in AS and constructed a four-gene (aldehyde dehydrogenase six family member A1 (ALDH6A1), eukaryotic elongation factor 2 kinase (EEF2K), glutaredoxin (GLRX) and l-lactate dehydrogenase B (LDHB)) diagnostic model with good accuracy. The four-gene diagnostic model was also found to have good discriminatory efficacy for the immune cell infiltration microenvironment of AS. Overall, these findings provide valuable information and directions for future research into Atherosclerosis diagnosis and aid in the discovery of biological mechanisms underlying AS with oxidative stress.
Keywords: GEO; LASSO; atherosclerosis; immune; oxidative stress.
Copyright © 2023 Tang, Deng, Luo and He.
Conflict of interest statement
The authors declare that the research was conducted in the absence of any commercial or financial relationships that could be construed as a potential conflict of interest.
Figures


Similar articles
-
Bioinformatics analysis of potential common pathogenic mechanism for carotid atherosclerosis and Parkinson's disease.Front Aging Neurosci. 2023 Aug 15;15:1202952. doi: 10.3389/fnagi.2023.1202952. eCollection 2023. Front Aging Neurosci. 2023. PMID: 37649719 Free PMC article.
-
Integrated analysis and identification of hub genes as novel biomarkers for Alzheimer's disease.Front Aging Neurosci. 2022 Aug 30;14:901972. doi: 10.3389/fnagi.2022.901972. eCollection 2022. Front Aging Neurosci. 2022. PMID: 36110430 Free PMC article.
-
Dysregulation and imbalance of innate and adaptive immunity are involved in the cardiomyopathy progression.Front Cardiovasc Med. 2022 Sep 6;9:973279. doi: 10.3389/fcvm.2022.973279. eCollection 2022. Front Cardiovasc Med. 2022. PMID: 36148059 Free PMC article.
-
Identifying the hub gene and immune infiltration of Parkinson's disease using bioinformatical methods.Brain Res. 2022 Jun 15;1785:147879. doi: 10.1016/j.brainres.2022.147879. Epub 2022 Mar 10. Brain Res. 2022. PMID: 35278479
-
The Integrated Analysis Identifies Three Critical Genes as Novel Diagnostic Biomarkers Involved in Immune Infiltration in Atherosclerosis.Front Immunol. 2022 May 18;13:905921. doi: 10.3389/fimmu.2022.905921. eCollection 2022. Front Immunol. 2022. PMID: 35663954 Free PMC article.
Cited by
-
HTK vs. HTK-N for Coronary Endothelial Protection during Hypothermic, Oxygenated Perfusion of Hearts Donated after Circulatory Death.Int J Mol Sci. 2024 Feb 13;25(4):2262. doi: 10.3390/ijms25042262. Int J Mol Sci. 2024. PMID: 38396938 Free PMC article.
-
Unraveling the immunogenetic landscape of autism spectrum disorder: a comprehensive bioinformatics approach.Front Immunol. 2024 Apr 24;15:1347139. doi: 10.3389/fimmu.2024.1347139. eCollection 2024. Front Immunol. 2024. PMID: 38726016 Free PMC article.
-
Significance of neutrophil extracellular traps-related gene in the diagnosis and classification of atherosclerosis.Apoptosis. 2024 Jun;29(5-6):605-619. doi: 10.1007/s10495-023-01923-4. Epub 2024 Feb 17. Apoptosis. 2024. PMID: 38367202
-
A new perspective on macrophage-targeted drug research: the potential of KDELR2 in bladder cancer immunotherapy.Front Immunol. 2024 Dec 3;15:1485109. doi: 10.3389/fimmu.2024.1485109. eCollection 2024. Front Immunol. 2024. PMID: 39691708 Free PMC article.
-
Analysis of regulatory patterns of NLRP3 corpuscles and related genes and the role of macrophage polarization in atherosclerosis based on online database.Mol Genet Genomics. 2024 Dec 27;300(1):7. doi: 10.1007/s00438-024-02216-4. Mol Genet Genomics. 2024. PMID: 39725776
References
LinkOut - more resources
Full Text Sources
Research Materials
Miscellaneous

