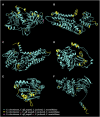
Whole genome sequencing of Clarireedia aff. paspali reveals potential pathogenesis factors in Clarireedia species, causal agents of dollar spot in turfgrass
- PMID: 36685867
- PMCID: PMC9849252
- DOI: 10.3389/fgene.2022.1033437
Whole genome sequencing of Clarireedia aff. paspali reveals potential pathogenesis factors in Clarireedia species, causal agents of dollar spot in turfgrass
Abstract
Dollar spot is one of the most damaging diseases in turfgrass, reducing its quality and playability. Two species, Clarireedia monteithiana and C. jacksonii (formerly Sclerotinia homoeocarpa) have been reported so far in the United States To study the Clarireedia genome, two isolates H2 and H3, sampled from seashore paspalum in Hawaii in 2019 were sequenced via Illumina paired-end sequencing by synthesis technology and PacBio SMRT sequencing. Both isolates were identified as C. aff. paspali, a novel species in the United States Using short and long reads, C. aff. paspali H3 contained 193 contigs with 48.6 Mbp and presented the most completed assembly and annotation among Clarireedia species. Out of the 13,428 protein models from AUGUSTUS, 349 cytoplasmic effectors and 13 apoplastic effectors were identified by EffectorP. To further decipher Clarireedia pathogenicity, C. aff. paspali genomes (H2 and H3), as well as available C. jacksonii (LWC-10 and HRI11), C. monteithiana (DRR09 and RB-19) genomes were screened for fifty-four pathogenesis determinants, previously identified in S. sclerotiorum. Seventeen orthologs of pathogenicity genes have been identified in Clarireedia species involved in oxalic acid production (pac1, nox1), mitogen-activated protein kinase cascade (pka1, smk3, ste12), appressorium formation (caf1, pks13, ams2, rgb1, rhs1) and glycolytic pathway (gpd). Within these genes, 366 species-specific SNPs were recorded between Clarireedia species; twenty-eight were non-synonymous and non-conservative. The predicted protein structure of six of these genes showed superimposition of the models among Clarireedia spp. The genomic variations revealed here could potentially lead to differences in pathogenesis and other physiological functions among Clarireedia species.
Keywords: Clarireedia paspali; PacBio and Illumina technologies; effectors; gene prediction; genome annotation; pathogenicity; phylogeny; protein structure prediction.
Copyright © 2023 Bahri, Parvathaneni, Spratling, Saxena, Sapkota, Raymer and Martinez-Espinoza.
Conflict of interest statement
The authors declare that the research was conducted in the absence of any commercial or financial relationships that could be construed as a potential conflict of interest.
Figures


Similar articles
-
Genome Resources for Four Clarireedia Species Causing Dollar Spot on Diverse Turfgrasses.Plant Dis. 2023 Mar;107(3):929-934. doi: 10.1094/PDIS-08-22-1921-A. Epub 2023 Jan 14. Plant Dis. 2023. PMID: 36265142
-
Genome Resources for Seven Fungal Isolates That Cause Dollar Spot Disease in Turfgrass, Including Clarireedia jacksonii and C. monteithiana.Plant Dis. 2021 Mar;105(3):691-694. doi: 10.1094/PDIS-06-20-1296-A. Epub 2021 Feb 8. Plant Dis. 2021. PMID: 32720885
-
Clarireedia hainanense: A New Species Is Associated with Dollar Spot of Turfgrass in Hainan, China.Plant Dis. 2022 Mar;106(3):996-1002. doi: 10.1094/PDIS-08-21-1853-RE. Epub 2022 Mar 6. Plant Dis. 2022. PMID: 34698519
-
New Approaches to an Old Problem: Dollar Spot of Turfgrass.Phytopathology. 2022 Mar;112(3):469-480. doi: 10.1094/PHYTO-11-20-0505-RVW. Epub 2022 Feb 18. Phytopathology. 2022. PMID: 34406790 Review.
-
Advantages of genome sequencing by long-read sequencer using SMRT technology in medical area.Hum Cell. 2017 Jul;30(3):149-161. doi: 10.1007/s13577-017-0168-8. Epub 2017 Mar 31. Hum Cell. 2017. PMID: 28364362 Free PMC article. Review.
Cited by
-
Nanopore sequencing and hybrid assembly: unraveling the genomic landscape of dollar spot with enhanced annotation and drug resistance profiling.Front Fungal Biol. 2025 Jul 17;6:1621663. doi: 10.3389/ffunb.2025.1621663. eCollection 2025. Front Fungal Biol. 2025. PMID: 40747239 Free PMC article.
-
Fungicide use intensity influences the soil microbiome and links to fungal disease suppressiveness in amenity turfgrass.Appl Environ Microbiol. 2025 Mar 19;91(3):e0177124. doi: 10.1128/aem.01771-24. Epub 2025 Feb 21. Appl Environ Microbiol. 2025. PMID: 39982054 Free PMC article.
References
-
- Aynardi B. A., Jiménez-Gasco M. M., Uddin W. (2019). Effects of isolates of Clarireedia jacksonii and Clarireedia monteithiana on severity of dollar spot in turfgrasses by host type. Eur. J. Plant Pathol. 155, 817–829. 10.1007/s10658-019-01813-z - DOI
-
- Barbosa M. S., Báo S. N., Andreotti P. F., Faria F. P. de, Felipe M. S. S., Feitosa L., et al. (2006). Glyceraldehyde-3-Phosphate dehydrogenase of paracoccidioides brasiliensis is a cell surface protein involved in fungal adhesion to extracellular matrix proteins and interaction with cells. Infect. Immun. 74 (1), 382–389. 10.1128/IAI.74.1.382-389.2006 - DOI - PMC - PubMed
LinkOut - more resources
Full Text Sources
Miscellaneous

