

Identification of the diagnostic genes and immune cell infiltration characteristics of gastric cancer using bioinformatics analysis and machine learning
- PMID: 36685898
- PMCID: PMC9845288
- DOI: 10.3389/fgene.2022.1067524
Identification of the diagnostic genes and immune cell infiltration characteristics of gastric cancer using bioinformatics analysis and machine learning
Abstract
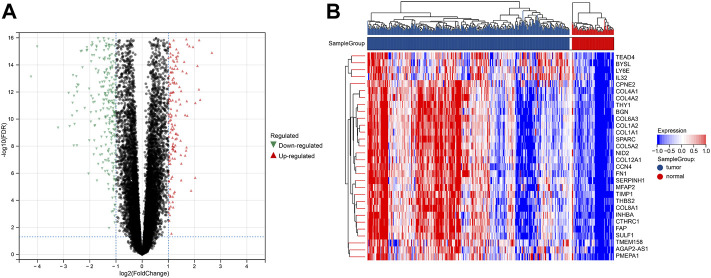
Background: Finding reliable diagnostic markers for gastric cancer (GC) is important. This work uses machine learning (ML) to identify GC diagnostic genes and investigate their connection with immune cell infiltration. Methods: We downloaded eight GC-related datasets from GEO, TCGA, and GTEx. GSE13911, GSE15459, GSE19826, GSE54129, and GSE79973 were used as the training set, GSE66229 as the validation set A, and TCGA & GTEx as the validation set B. First, the training set screened differentially expressed genes (DEGs), and gene ontology (GO), kyoto encyclopedia of genes and genomes (KEGG), disease Ontology (DO), and gene set enrichment analysis (GSEA) analyses were performed. Then, the candidate diagnostic genes were screened by LASSO and SVM-RFE algorithms, and receiver operating characteristic (ROC) curves evaluated the diagnostic efficacy. Then, the infiltration characteristics of immune cells in GC samples were analyzed by CIBERSORT, and correlation analysis was performed. Finally, mutation and survival analyses were performed for diagnostic genes. Results: We found 207 up-regulated genes and 349 down-regulated genes among 556 DEGs. gene ontology analysis significantly enriched 413 functional annotations, including 310 biological processes, 23 cellular components, and 80 molecular functions. Six of these biological processes are closely related to immunity. KEGG analysis significantly enriched 11 signaling pathways. 244 diseases were closely related to Ontology analysis. Multiple entries of the gene set enrichment analysis analysis were closely related to immunity. Machine learning screened eight candidate diagnostic genes and further validated them to identify ABCA8, COL4A1, FAP, LY6E, MAMDC2, and TMEM100 as diagnostic genes. Six diagnostic genes were mutated to some extent in GC. ABCA8, COL4A1, LY6E, MAMDC2, TMEM100 had prognostic value. Conclusion: We screened six diagnostic genes for gastric cancer through bioinformatic analysis and machine learning, which are intimately related to immune cell infiltration and have a definite prognostic value.
Keywords: LASSO; SVM-RFE; bioinformatics analysis; diagnostic gene; gastric cancer; immune cell infiltration; machine learning.
Copyright © 2023 Xie, Liu, Lu, He and Li.
Conflict of interest statement
The authors declare that the research was conducted in the absence of any commercial or financial relationships that could be construed as a potential conflict of interest.
Figures


Similar articles
-
Identification of effective diagnostic genes and immune cell infiltration characteristics in small cell lung cancer by integrating bioinformatics analysis and machine learning algorithms.Saudi Med J. 2024 Aug;45(8):771-782. doi: 10.15537/smj.2024.45.8.20240170. Saudi Med J. 2024. PMID: 39074893 Free PMC article.
-
Identification and Validation of the Diagnostic Characteristic Genes of Ovarian Cancer by Bioinformatics and Machine Learning.Front Genet. 2022 Jun 1;13:858466. doi: 10.3389/fgene.2022.858466. eCollection 2022. Front Genet. 2022. PMID: 35719392 Free PMC article.
-
Identification of diagnostic biomarkers of rheumatoid arthritis based on machine learning-assisted comprehensive bioinformatics and its correlation with immune cells.Heliyon. 2024 Aug 5;10(15):e35511. doi: 10.1016/j.heliyon.2024.e35511. eCollection 2024 Aug 15. Heliyon. 2024. PMID: 39170142 Free PMC article.
-
[Screen of key characteristic genes of nasopharyngeal carcinoma (NPC) base on machine learning and analysis of their correlation with immune cells].Xi Bao Yu Fen Zi Mian Yi Xue Za Zhi. 2023 Number;39(11):988-995. Xi Bao Yu Fen Zi Mian Yi Xue Za Zhi. 2023. PMID: 37980550 Chinese.
-
Identification of oxidative stress-related diagnostic markers and immune infiltration features for idiopathic pulmonary fibrosis by bibliometrics and bioinformatics.Front Med (Lausanne). 2024 Aug 6;11:1356825. doi: 10.3389/fmed.2024.1356825. eCollection 2024. Front Med (Lausanne). 2024. PMID: 39165378 Free PMC article. Review.
Cited by
-
ABCA8 Elevation Predicts the Prognosis and Exerts the Anti-oncogenic Effects on the Malignancy of Non-small Cell Lung Cancer via TCF21-Mediated Inactivation of PI3K/AKT.Mol Biotechnol. 2025 Jan;67(1):226-236. doi: 10.1007/s12033-023-00998-3. Epub 2023 Dec 28. Mol Biotechnol. 2025. PMID: 38153664
-
Infection with COVID-19 promotes the progression of pancreatic cancer through the PI3K-AKT signaling pathway.Discov Oncol. 2023 Dec 8;14(1):225. doi: 10.1007/s12672-023-00842-9. Discov Oncol. 2023. PMID: 38063927 Free PMC article.
-
Detection of transmembrane protein 100 in breast cancer: Correlation with malignant progression and chemosensitivity.Cytojournal. 2024 Dec 18;21:65. doi: 10.25259/Cytojournal_107_2024. eCollection 2024. Cytojournal. 2024. PMID: 39917003 Free PMC article.
-
Revealing Potential Therapeutic Targets in Gastric Cancer through Inflammation and Protein-Protein Interaction Hub Networks.J Cancer. 2025 Jun 12;16(8):2720-2736. doi: 10.7150/jca.112218. eCollection 2025. J Cancer. 2025. PMID: 40535808 Free PMC article.
-
Identification of effective diagnostic genes and immune cell infiltration characteristics in small cell lung cancer by integrating bioinformatics analysis and machine learning algorithms.Saudi Med J. 2024 Aug;45(8):771-782. doi: 10.15537/smj.2024.45.8.20240170. Saudi Med J. 2024. PMID: 39074893 Free PMC article.
References
-
- Coleman R. L., Oza A. M., Lorusso D., Aghajanian C., Oaknin A., Dean A., et al. (2017). Rucaparib maintenance treatment for recurrent ovarian carcinoma after response to platinum therapy (ARIEL3): A randomised, double-blind, placebo-controlled, phase 3 trial. Lancet 390 (10106), 1949–1961. 10.1016/S0140-6736(17)32440-6 - DOI - PMC - PubMed
LinkOut - more resources
Full Text Sources
Research Materials
Miscellaneous