

Functional impact of multi-omic interactions in breast cancer subtypes
- PMID: 36685900
- PMCID: PMC9850112
- DOI: 10.3389/fgene.2022.1078609
Functional impact of multi-omic interactions in breast cancer subtypes
Abstract
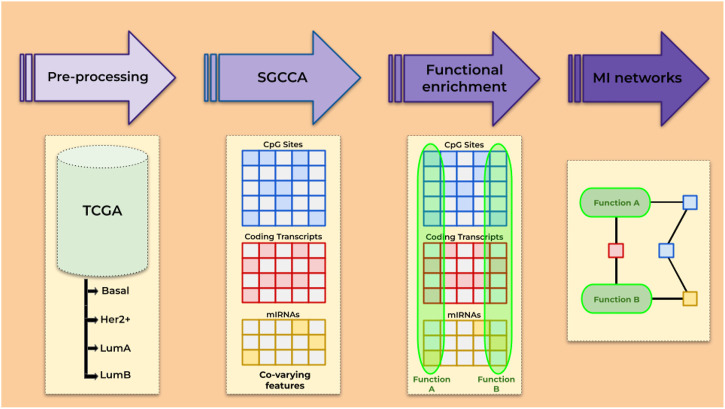
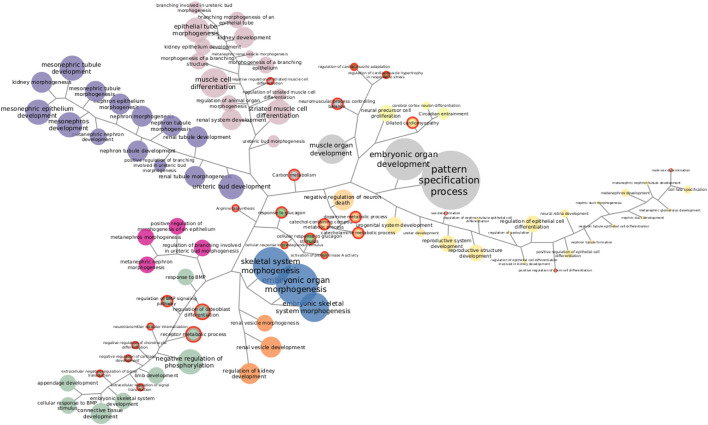
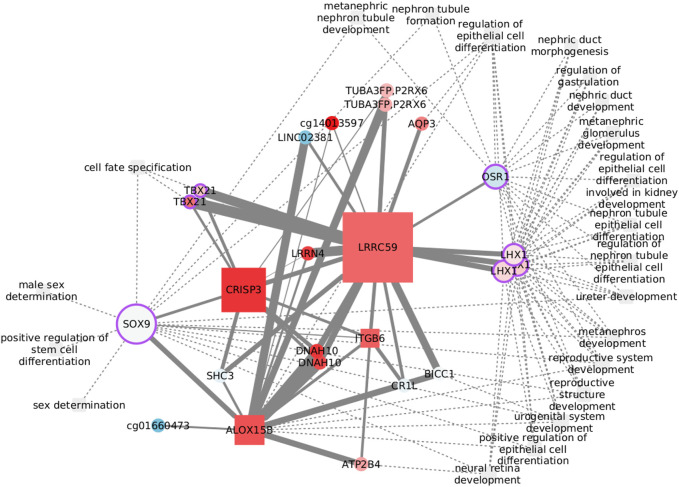
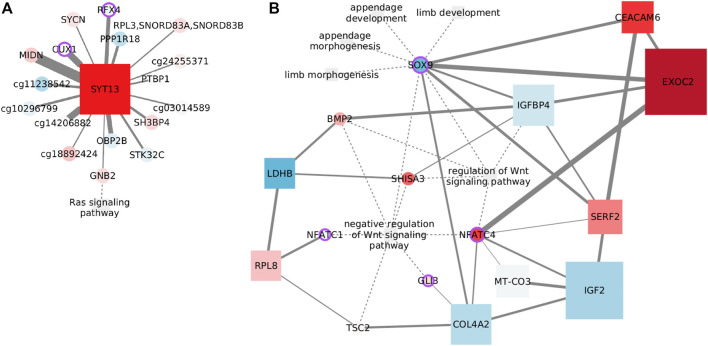
Multi-omic approaches are expected to deliver a broader molecular view of cancer. However, the promised mechanistic explanations have not quite settled yet. Here, we propose a theoretical and computational analysis framework to semi-automatically produce network models of the regulatory constraints influencing a biological function. This way, we identified functions significantly enriched on the analyzed omics and described associated features, for each of the four breast cancer molecular subtypes. For instance, we identified functions sustaining over-representation of invasion-related processes in the basal subtype and DNA modification processes in the normal tissue. We found limited overlap on the omics-associated functions between subtypes; however, a startling feature intersection within subtype functions also emerged. The examples presented highlight new, potentially regulatory features, with sound biological reasons to expect a connection with the functions. Multi-omic regulatory networks thus constitute reliable models of the way omics are connected, demonstrating a capability for systematic generation of mechanistic hypothesis.
Keywords: DNA methylation; HIF; RAS; SOX9; WNT; breast cancer; multi-omics; network biology.
Copyright © 2023 Ochoa and Hernández-Lemus.
Conflict of interest statement
The authors declare that the research was conducted in the absence of any commercial or financial relationships that could be construed as a potential conflict of interest.
Figures


Similar articles
-
Functional impact of multi-omic interactions in lung cancer.Front Genet. 2024 Feb 8;15:1282241. doi: 10.3389/fgene.2024.1282241. eCollection 2024. Front Genet. 2024. PMID: 38389572 Free PMC article.
-
Capturing the latent space of an Autoencoder for multi-omics integration and cancer subtyping.Comput Biol Med. 2022 Sep;148:105832. doi: 10.1016/j.compbiomed.2022.105832. Epub 2022 Jul 5. Comput Biol Med. 2022. PMID: 35834966
-
HCNM: Heterogeneous Correlation Network Model for Multi-level Integrative Study of Multi-omics Data for Cancer Subtype Prediction.Annu Int Conf IEEE Eng Med Biol Soc. 2021 Nov;2021:1880-1886. doi: 10.1109/EMBC46164.2021.9630781. Annu Int Conf IEEE Eng Med Biol Soc. 2021. PMID: 34891654
-
Multi-omic and multi-view clustering algorithms: review and cancer benchmark.Nucleic Acids Res. 2018 Nov 16;46(20):10546-10562. doi: 10.1093/nar/gky889. Nucleic Acids Res. 2018. PMID: 30295871 Free PMC article. Review.
-
Single-platform 'multi-omic' profiling: unified mass spectrometry and computational workflows for integrative proteomics-metabolomics analysis.Mol Omics. 2018 Oct 8;14(5):307-319. doi: 10.1039/c8mo00136g. Mol Omics. 2018. PMID: 30211418 Review.
Cited by
-
Coordinated inflammation and immune response transcriptional regulation in breast cancer molecular subtypes.Front Immunol. 2024 Jun 25;15:1357726. doi: 10.3389/fimmu.2024.1357726. eCollection 2024. Front Immunol. 2024. PMID: 38983850 Free PMC article.
-
Molecular Subtyping and Survival Analysis of Osteosarcoma Reveals Prognostic Biomarkers and Key Canonical Pathways.Cancers (Basel). 2023 Apr 4;15(7):2134. doi: 10.3390/cancers15072134. Cancers (Basel). 2023. PMID: 37046795 Free PMC article.
-
Potential Drug Synergy Through the ERBB2 Pathway in HER2+ Breast Tumors.Int J Mol Sci. 2024 Nov 29;25(23):12840. doi: 10.3390/ijms252312840. Int J Mol Sci. 2024. PMID: 39684551 Free PMC article.
-
Molecular mechanisms of multi-omic regulation in breast cancer.Front Oncol. 2023 Jul 25;13:1148861. doi: 10.3389/fonc.2023.1148861. eCollection 2023. Front Oncol. 2023. PMID: 37564937 Free PMC article. Review.
-
Functional impact of multi-omic interactions in lung cancer.Front Genet. 2024 Feb 8;15:1282241. doi: 10.3389/fgene.2024.1282241. eCollection 2024. Front Genet. 2024. PMID: 38389572 Free PMC article.
References
LinkOut - more resources
Full Text Sources
Research Materials