

A new ferroptosis-related genetic mutation risk model predicts the prognosis of skin cutaneous melanoma
- PMID: 36685905
- PMCID: PMC9849373
- DOI: 10.3389/fgene.2022.988909
A new ferroptosis-related genetic mutation risk model predicts the prognosis of skin cutaneous melanoma
Abstract
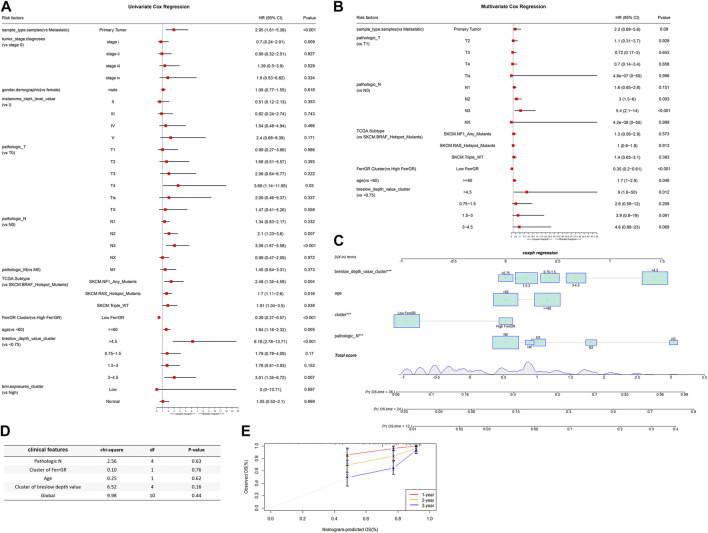
Background: Ferroptosis is an iron-dependent cell death mode and closely linked to various cancers, including skin cutaneous melanoma (SKCM). Although attempts have been made to construct ferroptosis-related gene (FRG) signatures for predicting the prognosis of SKCM, the prognostic impact of ferroptosis-related genetic mutations in SKCM remains lacking. This study aims to develop a prediction model to explain the relationship between ferroptosis-related genetic mutations and clinical outcomes of SKCM patients and to explore the potential value of ferroptosis in SKCM treatment. Methods: FRGs which significantly correlated with the prognosis of SKCM were firstly screened based on their single-nucleotide variant (SNV) status by univariate Cox regression analysis. Subsequently, the least absolute shrinkage and selection operator (LASSO) and Cox regressions were performed to construct a new ferroptosis-related genetic mutation risk (FerrGR) model for predicting the prognosis of SKCM. We then illustrate the survival and receiver operating characteristic (ROC) curves to evaluate the predictive power of the FerrGR model. Moreover, independent prognostic factors, genomic and clinical characteristics, immunotherapy, immune infiltration, and sensitive drugs were compared between high-and low-FerrGR groups. Results: The FerrGR model was developed with a good performance on survival and ROC analysis. It was a robust independent prognostic indicator and followed a nomogram constructed to predict prognostic outcomes for SKCM patients. Besides, FerrGR combined with tumor mutational burden (TMB) or MSI (microsatellite instability) was considered as a combined biomarker for immunotherapy response. The high FerrGR group patients were associated with an inhibitory immune microenvironment. Furthermore, potential drugs target to high FerrGR samples were predicted. Conclusion: The FerrGR model is valuable to predict prognosis and immunotherapy in SKCM patients. It offers a novel therapeutic option for SKCM.
Keywords: ferroptosis; genetic mutation; prognosis; single nucleotide variant; skin cutaneous melanoma; tumor immunity.
Copyright © 2023 He, Huang, Li, Wang, Nie, Li, Wang, Cao, Chen and Wang.
Conflict of interest statement
The authors declare that the research was conducted in the absence of any commercial or financial relationships that could be construed as a potential conflict of interest.
Figures


Similar articles
-
Ferroptosis-Related Gene Signature Predicts the Prognosis of Skin Cutaneous Melanoma and Response to Immunotherapy.Front Genet. 2021 Nov 3;12:758981. doi: 10.3389/fgene.2021.758981. eCollection 2021. Front Genet. 2021. PMID: 34804126 Free PMC article.
-
Multi-omics analysis for ferroptosis-related genes as prognostic factors in cutaneous melanoma.Zhong Nan Da Xue Xue Bao Yi Xue Ban. 2024 Feb 28;49(2):159-174. doi: 10.11817/j.issn.1672-7347.2024.230401. Zhong Nan Da Xue Xue Bao Yi Xue Ban. 2024. PMID: 38755712 Free PMC article.
-
Analysis and assessment of ferroptosis-related gene signatures and prognostic risk models in skin cutaneous melanoma.Transl Cancer Res. 2025 Mar 30;14(3):1857-1873. doi: 10.21037/tcr-24-1506. Epub 2025 Mar 19. Transl Cancer Res. 2025. PMID: 40224981 Free PMC article.
-
A Novel Ferroptosis-Related lncRNA Prognostic Model and Immune Infiltration Features in Skin Cutaneous Melanoma.Front Cell Dev Biol. 2022 Feb 3;9:790047. doi: 10.3389/fcell.2021.790047. eCollection 2021. Front Cell Dev Biol. 2022. PMID: 35186949 Free PMC article.
-
Ferroptosis-Associated Classifier and Indicator for Prognostic Prediction in Cutaneous Melanoma.J Oncol. 2021 Oct 28;2021:3658196. doi: 10.1155/2021/3658196. eCollection 2021. J Oncol. 2021. PMID: 34745259 Free PMC article. Review.
Cited by
-
Exosomal Non-coding RNAs: A New Approach to Melanoma Diagnosis and Therapeutic Strategy.Curr Med Chem. 2024;31(37):6084-6109. doi: 10.2174/0109298673267553231017053329. Curr Med Chem. 2024. PMID: 37877505 Review.
References
-
- Basit F., van Oppen L. M., Schöckel L., Bossenbroek H. M., van Emst-de Vries S. E., Hermeling J. C., et al. (2017). Mitochondrial complex I inhibition triggers a mitophagy-dependent ROS increase leading to necroptosis and ferroptosis in melanoma cells. Cell Death Dis. 8 (3), e2716. 10.1038/cddis.2017.133 - DOI - PMC - PubMed
-
- Birindelli S., Tragni G., Bartoli C., Ranzani G. N., Rilke F., Pierotti M. A., et al. (2000). Detection of microsatellite alterations in the spectrum of melanocytic nevi in patients with or without individual or family history of melanoma. Int. J. Cancer 86 (2), 255–261. 10.1002/(sici)1097-0215(20000415)86:2<255:aid-ijc16>3.0.co;2-l - DOI - PubMed
-
- Cesana G. C., DeRaffele G., Cohen S., Moroziewicz D., Mitcham J., Stoutenburg J., et al. (2006). Characterization of CD4+CD25+ regulatory T cells in patients treated with high-dose interleukin-2 for metastatic melanoma or renal cell carcinoma. J. Clin. Oncol. 24 (7), 1169–1177. 10.1200/JCO.2005.03.6830 - DOI - PubMed
LinkOut - more resources
Full Text Sources