

Transcriptomic analysis of the upper lip and primary palate development in mice
- PMID: 36685938
- PMCID: PMC9852879
- DOI: 10.3389/fgene.2022.1039850
Transcriptomic analysis of the upper lip and primary palate development in mice
Abstract
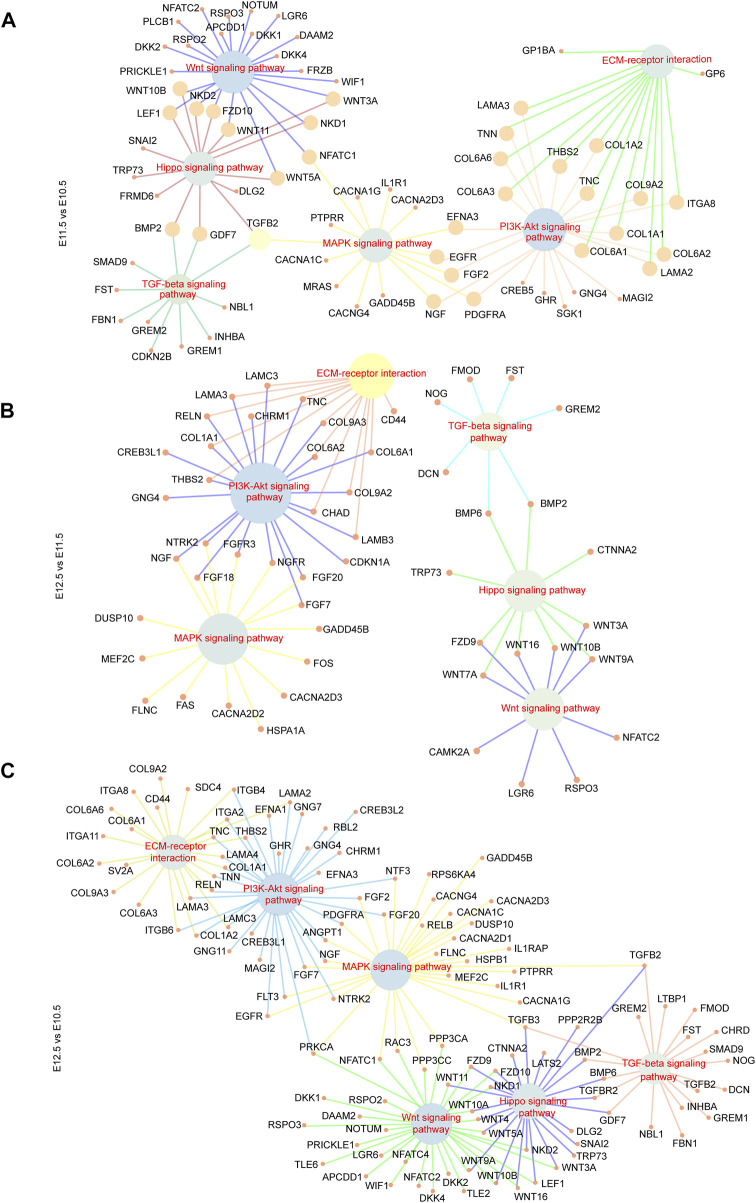
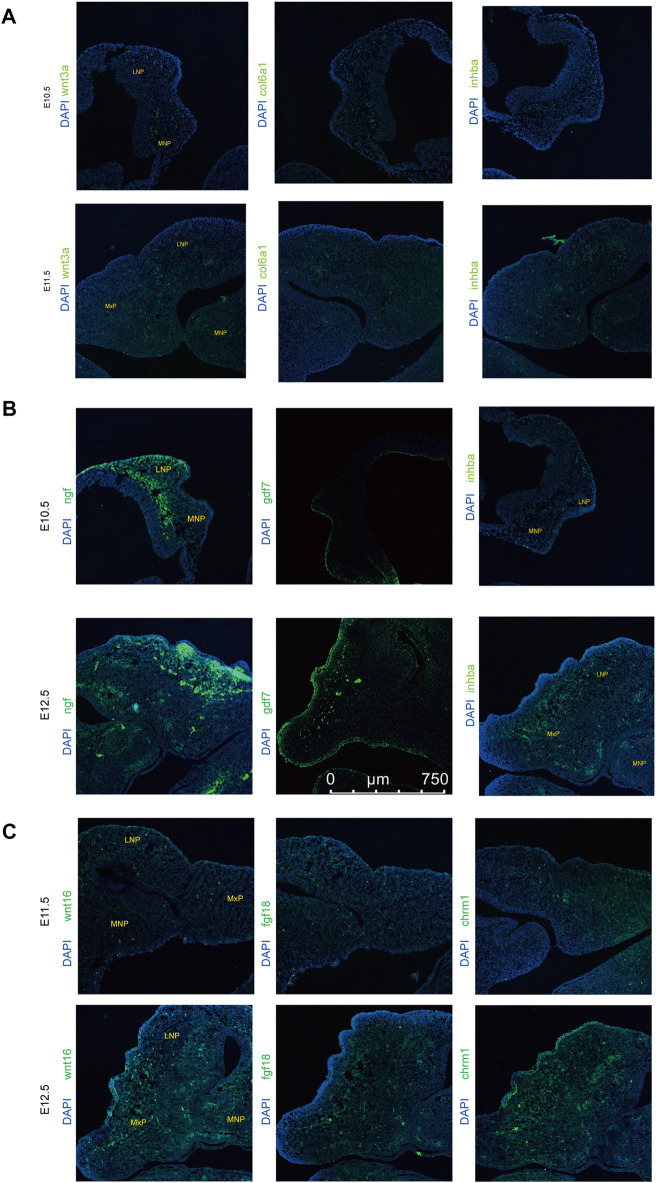
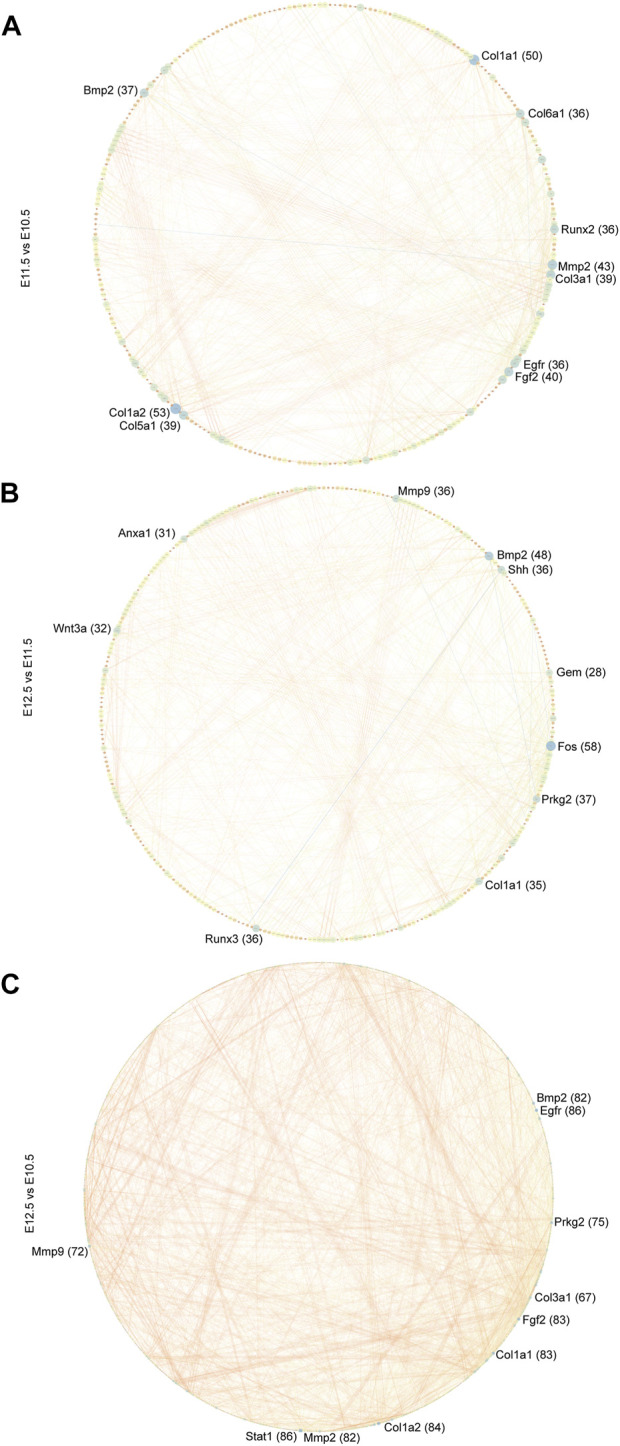
Background: Normal fusion of the upper lip and primary palate is a complex process involving a series of characteristic and orderly regulated cellular events. Cleft lip with or without palate (CL/P), one of the most common congenital malformations, may be induced by abnormalities in any of these events. However, less is known about the precise regulatory process in the fusion of the upper lip and primary palate. Methods: Lambdoidal junction tissues of mice from embryonic days 10.5, 11.5, and 12.5- three key fusion stages-were acquired for RNA sequencing. Results: Gene expression profiles in distinct fusion stages of mice were identified. Some of the differentially expressed genes (DEGs) have been reported to affect upper lip and primary palate development. However, other DEGs, such as Krt5, Pax1, Ambn, Hey2, and Tnmd, have not previously been investigated. Gene set enrichment analysis (GSEA) of these DEGs revealed the sequential intensification of Wnt, PI3K-Akt, MAPK, Hippo, and TGF-beta signaling pathways and identified relatively highly expressed genes including Tnn, Wnt3a, and Wnt16. We also observed substantial alternative splicing events during the fusion of the upper lip and primary palate and identified potentially important genes including Gtpbp8, Armcx1, Tle3, and Numa1. Protein-protein interaction (PPI) network analysis identified a series of hub genes, including Col1a2, Fos, Bmp2, Shh, Col1a1, Wnt3a, Anxa1, Gem, etc. Conclusion: Overall, the results of this study provided a comprehensive analysis of the development of the upper lip and primary palate. Our work provides insight into future studies of normal upper lip and primary palate development and the etiology of CL/P.
Keywords: RNA sequencing; cleft lip with or without cleft palate; development; gene expression profile; upper lip and primary palate.
Copyright © 2023 Cai, Si, Wang and Yin.
Conflict of interest statement
The authors declare that the research was conducted in the absence of any commercial or financial relationships that could be construed as a potential conflict of interest.
Figures


Similar articles
-
Single-cell transcriptome and chromatin accessibility mapping of upper lip and primary palate fusion.J Cell Mol Med. 2024 Oct;28(19):e70128. doi: 10.1111/jcmm.70128. J Cell Mol Med. 2024. PMID: 39392189 Free PMC article.
-
The molecular anatomy of mammalian upper lip and primary palate fusion at single cell resolution.Development. 2019 Jun 17;146(12):dev174888. doi: 10.1242/dev.174888. Development. 2019. PMID: 31118233 Free PMC article.
-
Molecular contribution to cleft palate production in cleft lip mice.Congenit Anom (Kyoto). 2014 May;54(2):94-9. doi: 10.1111/cga.12038. Congenit Anom (Kyoto). 2014. PMID: 24206222 Free PMC article.
-
A comprehensive analysis of AHRR gene as a candidate for cleft lip with or without cleft palate.Mutat Res Rev Mutat Res. 2020 Jul-Sep;785:108319. doi: 10.1016/j.mrrev.2020.108319. Epub 2020 Jun 5. Mutat Res Rev Mutat Res. 2020. PMID: 32800270
-
Wnt signaling in lip and palate development.Front Oral Biol. 2012;16:81-90. doi: 10.1159/000337619. Epub 2012 Jun 25. Front Oral Biol. 2012. PMID: 22759672 Review.
Cited by
-
Single-cell transcriptome and chromatin accessibility mapping of upper lip and primary palate fusion.J Cell Mol Med. 2024 Oct;28(19):e70128. doi: 10.1111/jcmm.70128. J Cell Mol Med. 2024. PMID: 39392189 Free PMC article.
-
Identification of a Novel Variant of PDGFC Associated with Nonsyndromic Cleft Lip and Palate in a Chinese Family.Int J Genomics. 2023 Sep 21;2023:8814046. doi: 10.1155/2023/8814046. eCollection 2023. Int J Genomics. 2023. PMID: 37779880 Free PMC article.
References
-
- Chen A., Beetham H., Black M. A., Priya R., Telford B. J., Guest J., et al. (2014). E-cadherin loss alters cytoskeletal organization and adhesion in non-malignant breast cells but is insufficient to induce an epithelial-mesenchymal transition. BMC cancer 14, 552. 10.1186/1471-2407-14-552 - DOI - PMC - PubMed
LinkOut - more resources
Full Text Sources
Molecular Biology Databases
Research Materials
Miscellaneous