

Immune-related gene signature associates with immune landscape and predicts prognosis accurately in patients with skin cutaneous melanoma
- PMID: 36685954
- PMCID: PMC9845246
- DOI: 10.3389/fgene.2022.1095867
Immune-related gene signature associates with immune landscape and predicts prognosis accurately in patients with skin cutaneous melanoma
Abstract
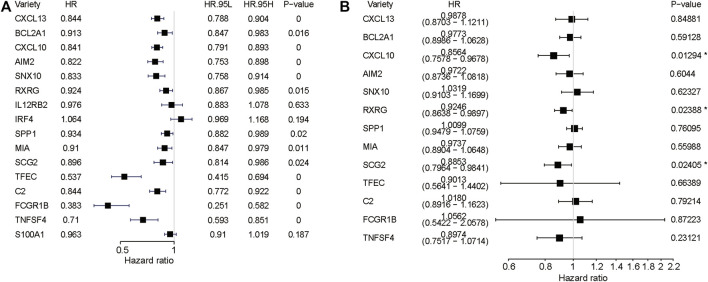
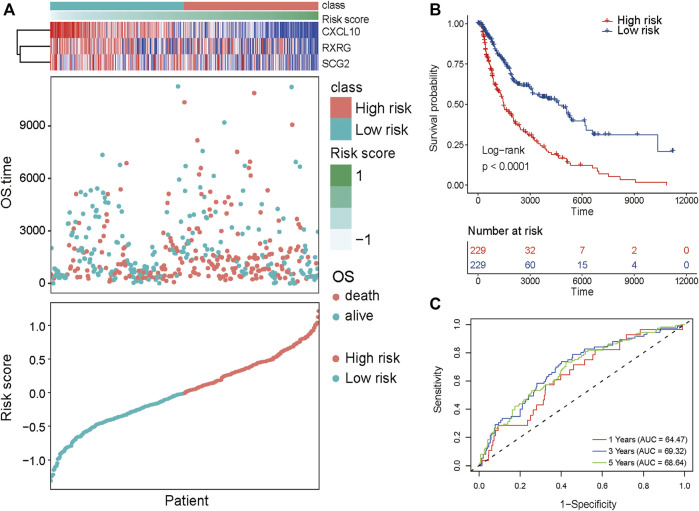
Skin cutaneous melanoma (SKCM) is the skin cancer that causes the highest number of deaths worldwide. There is growing evidence that the tumour immune microenvironment is associated with cancer prognosis, however, there is little research on the role of immune status in melanoma prognosis. In this study, data on patients with Skin cutaneous melanoma were downloaded from the GEO, TCGA, and GTEx databases. Genes associated with the immune pathway were screened from published papers and lncRNAs associated with them were identified. We performed immune microenvironment and functional enrichment analyses. The analysis was followed by applying univariate/multivariate Cox regression algorithms to finally identify three lncRNAs associated with the immune pathway for the construction of prognostic prediction models (CXCL10, RXRG, and SCG2). This stepwise downscaling method, which finally screens out prognostic factors and key genes and then uses them to build a risk model, has excellent predictive power. According to analyses of the model's reliability, it was able to differentiate the prognostic value and continued existence of Skin cutaneous melanoma patient populations more effectively. This study is an analysis of the immune pathway that leads lncRNAs in Skin cutaneous melanoma in an effort to open up new treatment avenues for Skin cutaneous melanoma.
Keywords: bioinformatics; immune pathway; prognosis; skin cutaneous melanoma; tumor environment.
Copyright © 2023 Shen, Shang, Han, Zhang, Niu, Liu and Shi.
Conflict of interest statement
The authors declare that the research was conducted in the absence of any commercial or financial relationships that could be construed as a potential conflict of interest.
Figures
Similar articles
-
Construction of five cuproptosis-related lncRNA signature for predicting prognosis and immune activity in skin cutaneous melanoma.Front Genet. 2022 Sep 7;13:972899. doi: 10.3389/fgene.2022.972899. eCollection 2022. Front Genet. 2022. PMID: 36160015 Free PMC article.
-
DNA damage repair-related gene signature predicts prognosis and indicates immune cell infiltration landscape in skin cutaneous melanoma.Front Endocrinol (Lausanne). 2022 Jul 26;13:882431. doi: 10.3389/fendo.2022.882431. eCollection 2022. Front Endocrinol (Lausanne). 2022. PMID: 35957812 Free PMC article.
-
Development and validation of an immune gene set-based prognostic signature in cutaneous melanoma.Future Oncol. 2021 Nov;17(31):4115-4129. doi: 10.2217/fon-2021-0104. Epub 2021 Jul 22. Future Oncol. 2021. PMID: 34291650
-
Analysis of immune subtypes based on immunogenomic profiling identifies prognostic signature for cutaneous melanoma.Int Immunopharmacol. 2020 Dec;89(Pt A):107162. doi: 10.1016/j.intimp.2020.107162. Epub 2020 Nov 7. Int Immunopharmacol. 2020. PMID: 33168410
-
The Landscape of the Tumor Microenvironment in Skin Cutaneous Melanoma Reveals a Prognostic and Immunotherapeutically Relevant Gene Signature.Front Cell Dev Biol. 2021 Oct 1;9:739594. doi: 10.3389/fcell.2021.739594. eCollection 2021. Front Cell Dev Biol. 2021. PMID: 34660598 Free PMC article.
Cited by
-
A seven-immune-genes risk model predicts the survival and suitable treatments for patients with skin cutaneous melanoma.Heliyon. 2023 Sep 19;9(9):e20234. doi: 10.1016/j.heliyon.2023.e20234. eCollection 2023 Sep. Heliyon. 2023. PMID: 37809963 Free PMC article.
-
Analysis and assessment of ferroptosis-related gene signatures and prognostic risk models in skin cutaneous melanoma.Transl Cancer Res. 2025 Mar 30;14(3):1857-1873. doi: 10.21037/tcr-24-1506. Epub 2025 Mar 19. Transl Cancer Res. 2025. PMID: 40224981 Free PMC article.
References
LinkOut - more resources
Full Text Sources