. 2023 Jan 4:9:1073746.
doi: 10.3389/frobt.2022.1073746. eCollection 2022.

Using robot-assisted stiffness perturbations to evoke aftereffects useful to post-stroke gait rehabilitation

Affiliations

Using robot-assisted stiffness perturbations to evoke aftereffects useful to post-stroke gait rehabilitation

Vaughn Chambers et al. Front Robot AI. .

Abstract

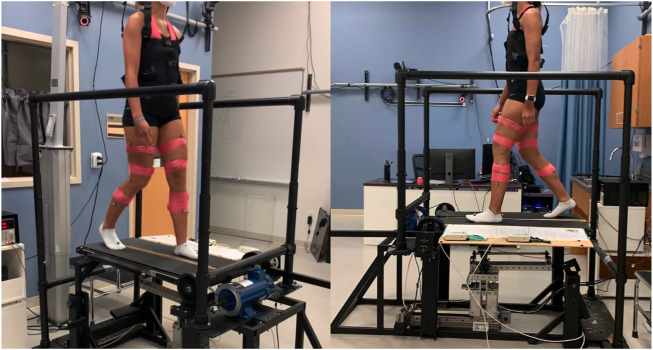
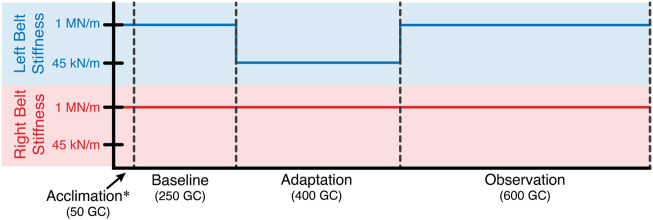
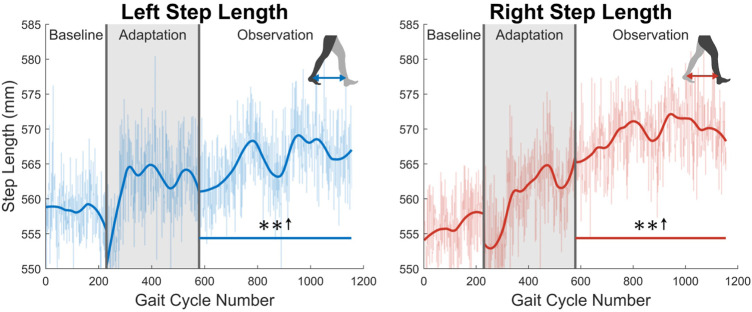
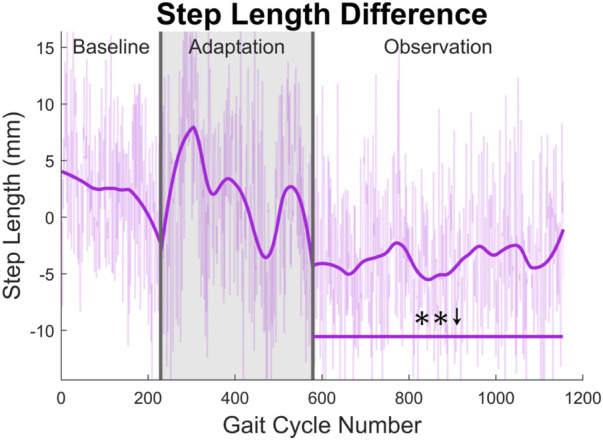
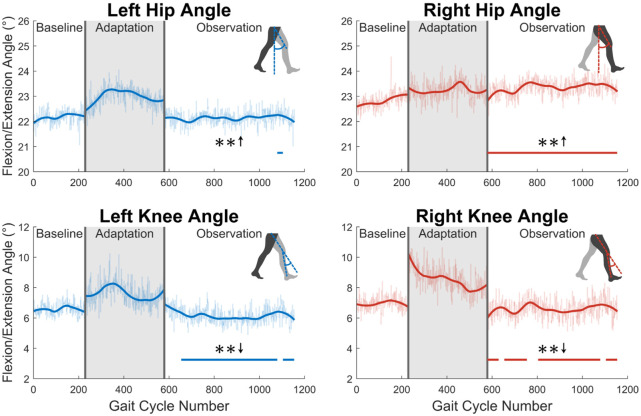
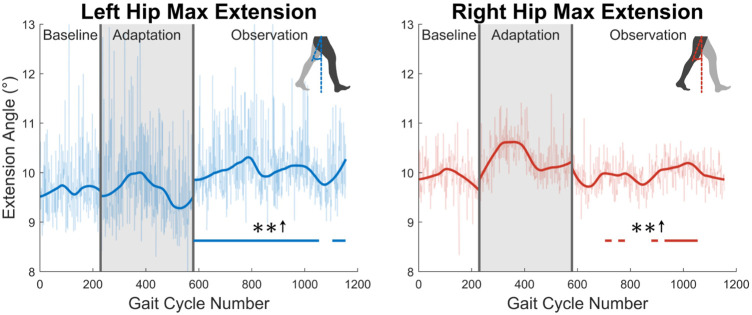
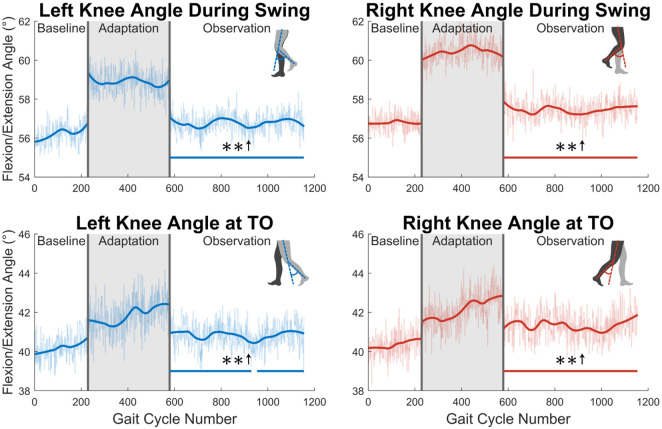
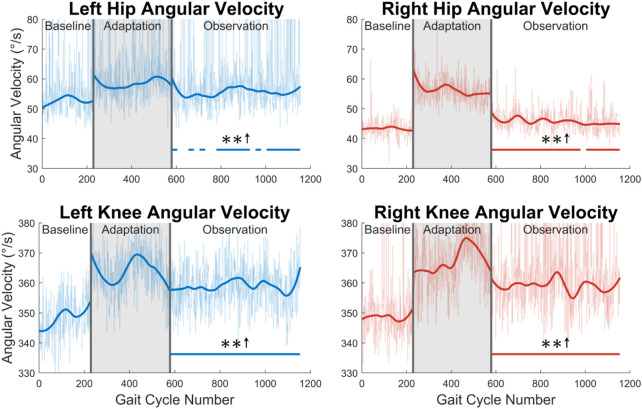
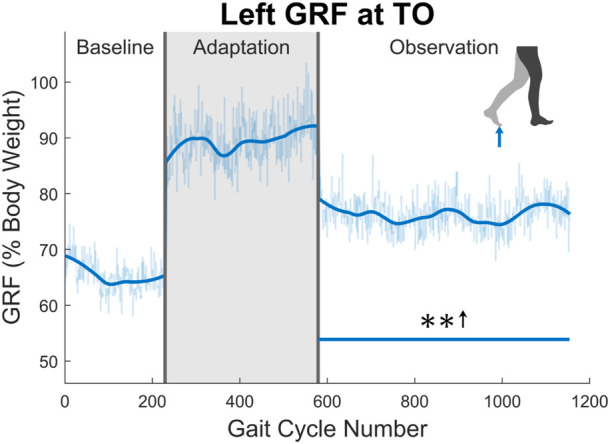
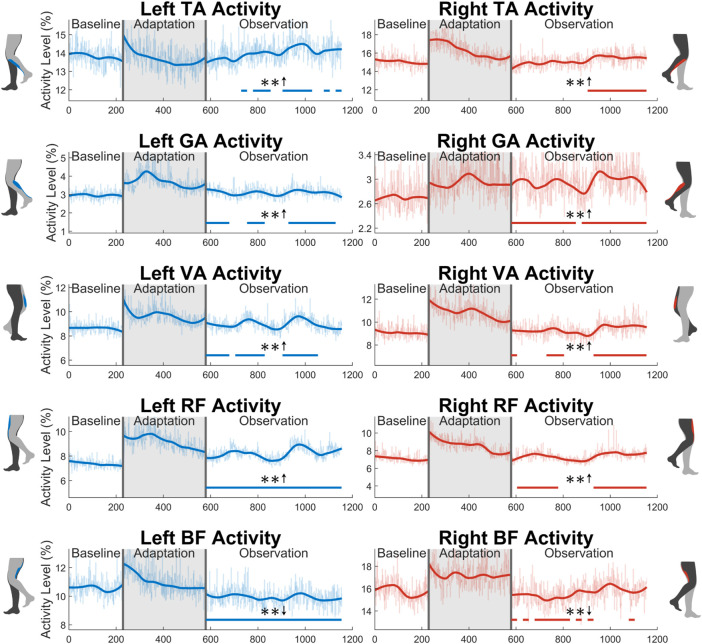
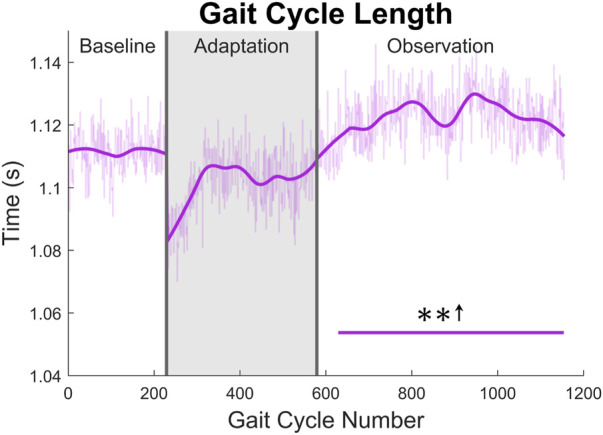
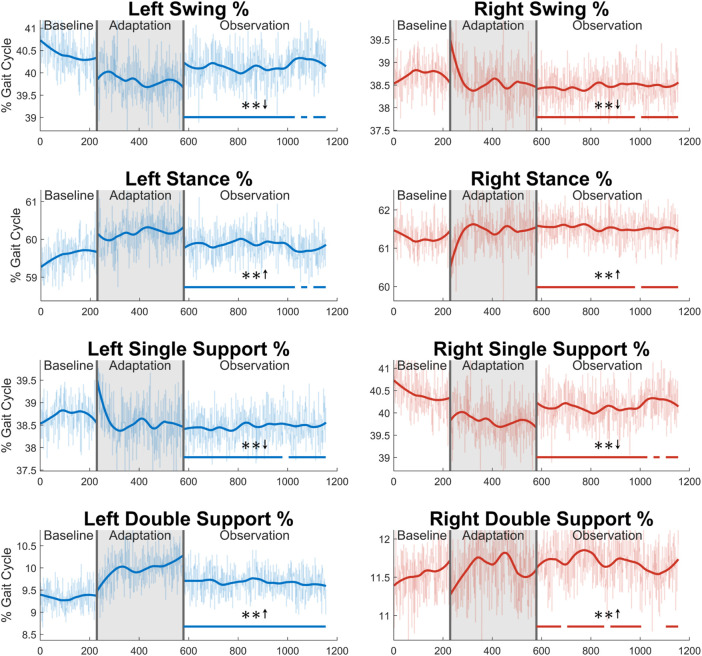
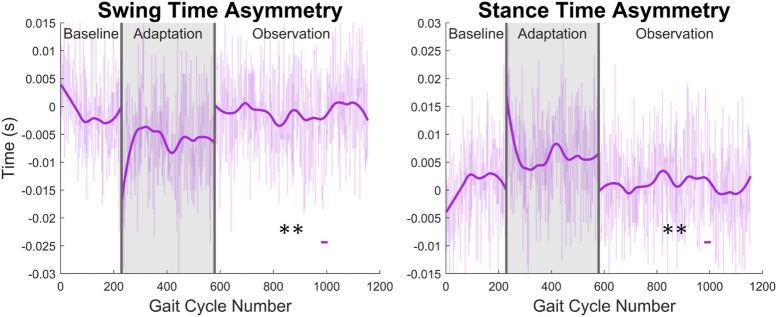
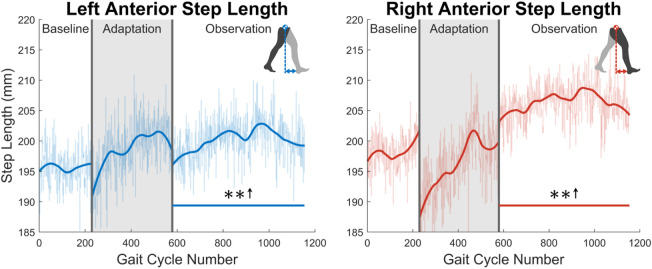
Stroke is a major global issue, affecting millions every year. When a stroke occurs, survivors are often left with physical disabilities or difficulties, frequently marked by abnormal gait. Post-stroke gait normally presents as one of or a combination of unilaterally shortened step length, decreased dorsiflexion during swing phase, and decreased walking speed. These factors lead to an increased chance of falling and an overall decrease in quality of life due to a reduced ability to locomote quickly and safely under one's own power. Many current rehabilitation techniques fail to show lasting results that suggest the potential for producing permanent changes. As technology has advanced, robot-assisted rehabilitation appears to have a distinct advantage, as the precision and repeatability of such an intervention are not matched by conventional human-administered therapy. The possible role in gait rehabilitation of the Variable Stiffness Treadmill (VST), a unique, robotic treadmill, is further investigated in this paper. The VST is a split-belt treadmill that can reduce the vertical stiffness of one of the belts, while the other belt remains rigid. In this work, we show that the repeated unilateral stiffness perturbations created by this device elicit an aftereffect of increased step length that is seen for over 575 gait cycles with healthy subjects after a single 10-min intervention. These long aftereffects are currently unmatched in the literature according to our knowledge. This step length increase is accompanied by kinematics and muscle activity aftereffects that help explain functional changes and have their own independent value when considering the characteristics of post-stroke gait. These results suggest that repeated unilateral stiffness perturbations could possibly be a useful form of post-stroke gait rehabilitation.

Keywords: adaptation; aftereffects; gait; rehabilitation; robotics; stroke; treadmill; walking.


Conflict of interest statement

The authors declare that the research was conducted in the absence of any commercial or financial relationships that could be construed as a potential conflict of interest.

Figures

FIGURE 1
FIGURE 1
Subject walking on the VST with both belts set to rigid. Reflective markers and EMGs can be seen on the subject, as well as the safety harness.
FIGURE 2
FIGURE 2
Experiment layout in terms of gait cycles. For the entire experiment, the stiffness of the right treadmill belt remained rigid (1 MN/m). The stiffness of the left treadmill belt was reduced to 45 kN/m for the adaptation phase. Otherwise, the left belt stiffness was also rigid.
FIGURE 3
FIGURE 3
Marker locations on each subject. Twenty-two reflective markers were used for motion capture analysis. The center of mass was estimated as the average between LASI, RASI, LPSI, and RSPI markers.
FIGURE 4
FIGURE 4
Left and right step length averaged for all 12 subjects. Step length was calculated as the projected distance between ankles in the floor plane at the time of heel strike. Both left and right step lengths are statistically significant for the entire observation phase, as indicated by the significance line. All significance testing was performed on “unsmoothed” data (seen in the lighter line). The darker line is the data smoothed by 2nd-degree polynomial local regression and was added only to allow the reader to more clearly see trends in the data.
FIGURE 5
FIGURE 5
Step length asymmetry averaged for all 12 subjects. Step length was calculated as the projected distance between ankles in the floor plane at the time of heel strike. For this figure, step length asymmetry was found by subtracting right step length from left step length. The right step length is significantly greater for the entire observation phase, as indicated by the significance line. All significance testing was performed on “unsmoothed” data (seen in the lighter line). The darker line is the data smoothed by 2nd-degree polynomial local regression and was added only to allow the reader to more clearly see trends in the data.
FIGURE 6
FIGURE 6
Hip and knee flexion/extension angles at heel strike for both left and right sides. Significance is shown in the observation phase as compared to the baseline phase by the significance line. All significance testing was performed on “unsmoothed” data (seen in the lighter line). The darker line is the data smoothed by 2nd-degree polynomial local regression and was added only to allow the reader to more clearly see trends in the data.
FIGURE 7
FIGURE 7
Maximum hip extension throughout the gait cycle for left and right legs. Note that values are positive because the extension angle was used instead of the flexion/extension angle for this figure. Significance is shown in the observation phase as compared to the baseline phase by the significance line. All significance testing was performed on “unsmoothed” data (seen in the lighter line). The darker line is the data smoothed by 2nd-degree polynomial local regression and was added only to allow the reader to more clearly see trends in the data.
FIGURE 8
FIGURE 8
The top two graphs display maximum left and right knee flexion/extension angle during the swing phase. The bottom two graphs show knee flexion/extension angle at the instant that toe-off occurs. Significance is shown in the observation phase as compared to the baseline phase by the significance line. All significance testing was performed on “unsmoothed” data (seen in the lighter line). The darker line is the data smoothed by 2nd-degree polynomial local regression and was added only to allow the reader to more clearly see trends in the data.
FIGURE 9
FIGURE 9
Maximum hip and knee angular velocities during the swing phase for both left and right legs. Significance is shown in the observation phase as compared to the baseline phase by the significance line. All significance testing was performed on “unsmoothed” data (seen in the lighter line). The darker line is the data smoothed by 2nd-degree polynomial local regression and was added only to allow the reader to more clearly see trends in the data.
FIGURE 10
FIGURE 10
Maximum vertical ground reaction force between midstance and toe-off for the left leg in percent body weight. Significance is shown in the observation phase as compared to the baseline phase by the significance line. All significance testing was performed on “unsmoothed” data (seen in the lighter line). The darker line is the data smoothed by 2nd-degree polynomial local regression and was added only to allow the reader to more clearly see trends in the data.
FIGURE 11
FIGURE 11
Average muscle activity during swing phase for all 10 muscles measured in this study: tibialis anterior, gastrocnemius, vastus medialis, rectus femoris, and biceps femoris. Significance is shown in the observation phase as compared to the baseline phase by the significance line. All significance testing was performed on “unsmoothed” data (seen in the lighter line). The darker line is the data smoothed by 2nd-degree polynomial local regression and was added only to allow the reader to more clearly see trends in the data.
FIGURE 12
FIGURE 12
Gait cycle length with respect to time (measured from left heel strike to left heel strike). Significance is shown in the observation phase as compared to the baseline phase by the significance line. All significance testing was performed on “unsmoothed” data (seen in the lighter line). The darker line is the data smoothed by 2nd-degree polynomial local regression and was added only to allow the reader to more clearly see trends in the data.
FIGURE 13
FIGURE 13
Sections of the gait cycle displayed with respect to how much of the entire gait cycle they occupy (in terms of percentage). The double support phase is determined to be left or right depending on which foot is in front and has more recently achieved heel strike. Significance is shown in the observation phase as compared to the baseline phase by the significance line. All significance testing was performed on “unsmoothed” data (seen in the lighter line). The darker line is the data smoothed by 2nd-degree polynomial local regression and was added only to allow the reader to more clearly see trends in the data.
FIGURE 14
FIGURE 14
Swing and stance time asymmetry in terms of time. For the swing phase, asymmetry was found by subtracting the time spent in right swing from the time spent in left swing. For the stance phase, the same process was used. Significance is shown in the observation phase as compared to the baseline phase by the significance line. All significance testing was performed on “unsmoothed” data (seen in the lighter line). The darker line is the data smoothed by 2nd-degree polynomial local regression and was added only to allow the reader to more clearly see trends in the data.
FIGURE 15
FIGURE 15
Left and right anterior step length averaged for all 12 subjects. Anterior step length was calculated as the anterior/posterior distance between the center of mass and the leading heel at heel strike. Significance is shown in the observation phase as compared to the baseline phase by the significance line. All significance testing was performed on “unsmoothed” data (seen in the lighter line). The darker line is the data smoothed by 2nd-degree polynomial local regression and was added only to allow the reader to more clearly see trends in the data.

Similar articles

Cited by

References

    1. Balaban B., Tok F. (2014). Gait disturbances in patients with stroke. PM&R 6, 635–642. 10.1016/j.pmrj.2013.12.017 - DOI - PubMed
    1. Barkan A., Skidmore J., Artemiadis P. (2014). “Variable stiffness treadmill (VST): A novel tool for the investigation of gait,” in Proceedings - IEEE international conference on robotics and automation (Hong Kong, China: Institute of Electrical and Electronics Engineers Inc.), 2838–2843. 10.1109/ICRA.2014.6907266 - DOI
    1. Chambers V., Artemiadis P. (2021). A model-based analysis of supraspinal mechanisms of inter-leg coordination in human gait: Toward model-informed robot-assisted rehabilitation. IEEE Trans. Neural Syst. Rehabilitation Eng. 29, 740–749. 10.1109/tnsre.2021.3072771 - DOI - PubMed
    1. Chambers V., Artemiadis P. (2022). “Repeated robot-assisted unilateral stiffness perturbations result in significant aftereffects relevant to post-stroke gait rehabilitation,” in IEEE international conference on robotics and automation (ICRA) (IEEE; ), 5426–5433.
    1. Chen G., Patten C., Kothari D. H., Zajac F. E. (2005). Gait differences between individuals with post-stroke hemiparesis and non-disabled controls at matched speeds. Gait Posture 22, 51–56. 10.1016/j.gaitpost.2004.06.009 - DOI - PubMed