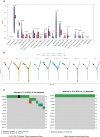
Novel biomarkers predict prognosis and drug-induced neuroendocrine differentiation in patients with prostate cancer
- PMID: 36686485
- PMCID: PMC9849576
- DOI: 10.3389/fendo.2022.1005916
Novel biomarkers predict prognosis and drug-induced neuroendocrine differentiation in patients with prostate cancer
Abstract
Background: A huge focus is being placed on the development of novel signatures in the form of new combinatorial regimens to distinguish the neuroendocrine (NE) characteristics from castration resistant prostate cancer (CRPC) timely and accurately, as well as predict the disease-free survival (DFS) and progression-free survival (PFS) of prostate cancer (PCa) patients.
Methods: Single cell data of 4 normal samples, 3 CRPC samples and 3 CRPC-NE samples were obtained from GEO database, and CellChatDB was used for potential intercellular communication, Secondly, using the "limma" package (v3.52.0), we obtained the differential expressed genes between CRPC and CRPC-NE both in single-cell RNA seq and bulk RNA seq samples, and discovered 12 differential genes characterized by CRPC-NE. Then, on the one hand, the diagnosis model of CRPC-NE is developed by random forest algorithm and artificial neural network (ANN) through Cbioportal database; On the other hand, using the data in Cbioportal and GEO database, the DFS and PFS prognostic model of PCa was established and verified through univariate Cox analysis, least absolute shrinkage and selection operator (Lasso) regression and multivariate Cox regression in R software. Finally, somatic mutation and immune infiltration were also discussed.
Results: Our research shows that there exists specific intercellular communication in classified clusters. Secondly, a CRPC-NE diagnostic model of six genes (HMGN2, MLLT11, SOX4, PCSK1N, RGS16 and PTMA) has been established and verified, the area under the ROC curve (AUC) is as high as 0.952 (95% CI: 0.882-0.994). The mutation landscape shows that these six genes are rarely mutated in the CRPC and NEPC samples. In addition, NE-DFS signature (STMN1 and PCSK1N) and NE-PFS signature (STMN1, UBE2S and HMGN2) are good predictors of DFS and PFS in PCa patients and better than other clinical features. Lastly, the infiltration levels of plasma cells, T cells CD4 naive, Eosinophils and Monocytes were significantly different between the CRPC and NEPC groups.
Conclusions: This study revealed the heterogeneity between CRPC and CRPC-NE from different perspectives, and developed a reliable diagnostic model of CRPC-NE and robust prognostic models for PCa.
Keywords: castration-resistant prostate cancer; cellular communication; neuroendocrine; prognosis; single-cell RNA-seq.
Copyright © 2023 Lin, Cai, Wang, Ma, Pan, Liu and Zhao.
Conflict of interest statement
The authors declare that the research was conducted in the absence of any commercial or financial relationships that could be construed as a potential conflict of interest.
Figures


Similar articles
-
Identification of Novel Diagnosis Biomarkers for Therapy-Related Neuroendocrine Prostate Cancer.Pathol Oncol Res. 2021 Sep 27;27:1609968. doi: 10.3389/pore.2021.1609968. eCollection 2021. Pathol Oncol Res. 2021. PMID: 34646089 Free PMC article.
-
Machine learning-based identification of co-expressed genes in prostate cancer and CRPC and construction of prognostic models.Sci Rep. 2025 Feb 16;15(1):5679. doi: 10.1038/s41598-025-90444-y. Sci Rep. 2025. PMID: 39956870 Free PMC article.
-
L1CAM mediates neuroendocrine phenotype acquisition in prostate cancer cells.Prostate. 2024 Dec;84(16):1434-1447. doi: 10.1002/pros.24782. Epub 2024 Aug 18. Prostate. 2024. PMID: 39154281
-
Neuroendocrine Differentiation in Prostate Cancer: Emerging Biology, Models, and Therapies.Cold Spring Harb Perspect Med. 2019 Feb 1;9(2):a030593. doi: 10.1101/cshperspect.a030593. Cold Spring Harb Perspect Med. 2019. PMID: 29844220 Free PMC article. Review.
-
Molecular model for neuroendocrine prostate cancer progression.BJU Int. 2018 Oct;122(4):560-570. doi: 10.1111/bju.14207. Epub 2018 Apr 24. BJU Int. 2018. PMID: 29569310 Review.
Cited by
-
Identifying MSMO1, ELOVL6, AACS, and CERS2 related to lipid metabolism as biomarkers of Parkinson's disease.Sci Rep. 2024 Jul 30;14(1):17478. doi: 10.1038/s41598-024-68585-3. Sci Rep. 2024. PMID: 39080336 Free PMC article.
-
Neoadjuvant PD-1 blockade induces the autophagy of immune cells: a new target for synergistic therapy of recurrent glioblastoma.Biochem Biophys Rep. 2025 Jun 27;43:102119. doi: 10.1016/j.bbrep.2025.102119. eCollection 2025 Sep. Biochem Biophys Rep. 2025. PMID: 40678806 Free PMC article.
-
Aggrephagy-related patterns in tumor microenvironment, prognosis, and immunotherapy for acute myeloid leukemia: a comprehensive single-cell RNA sequencing analysis.Front Oncol. 2023 Jul 17;13:1195392. doi: 10.3389/fonc.2023.1195392. eCollection 2023. Front Oncol. 2023. PMID: 37534253 Free PMC article.
-
[Dynamic trajectory and cell communication of different cell clusters in malignant progression of glioblastoma].Beijing Da Xue Xue Bao Yi Xue Ban. 2024 Apr 18;56(2):199-206. doi: 10.19723/j.issn.1671-167X.2024.02.001. Beijing Da Xue Xue Bao Yi Xue Ban. 2024. PMID: 38595234 Free PMC article. Chinese.
-
Identification of cell differentiation trajectory-related gene signature to reveal the prognostic significance and immune landscape in prostate cancer based on multiomics analysis.Heliyon. 2024 Mar 8;10(6):e27628. doi: 10.1016/j.heliyon.2024.e27628. eCollection 2024 Mar 30. Heliyon. 2024. PMID: 38510027 Free PMC article.
References
-
- Alanee S, Moore A, Nutt M, Holland B, Dynda D, El-Zawahry A, et al. . Contemporary incidence and mortality rates of neuroendocrine prostate cancer. Anticancer Res (2015) 35(7):4145–50. - PubMed
MeSH terms
Substances
Associated data
- Actions
- Actions
LinkOut - more resources
Full Text Sources
Research Materials
Miscellaneous

