

Depiction of immune heterogeneity of peripheral blood from patients with type II diabetic nephropathy based on mass cytometry
- PMID: 36686486
- PMCID: PMC9853014
- DOI: 10.3389/fendo.2022.1018608
Depiction of immune heterogeneity of peripheral blood from patients with type II diabetic nephropathy based on mass cytometry
Erratum in
-
Corrigendum: Depiction of immune heterogeneity of peripheral blood from patients with type II diabetic nephropathy based on mass cytometry.Front Endocrinol (Lausanne). 2023 Mar 7;14:1168889. doi: 10.3389/fendo.2023.1168889. eCollection 2023. Front Endocrinol (Lausanne). 2023. PMID: 36967806 Free PMC article.
Abstract
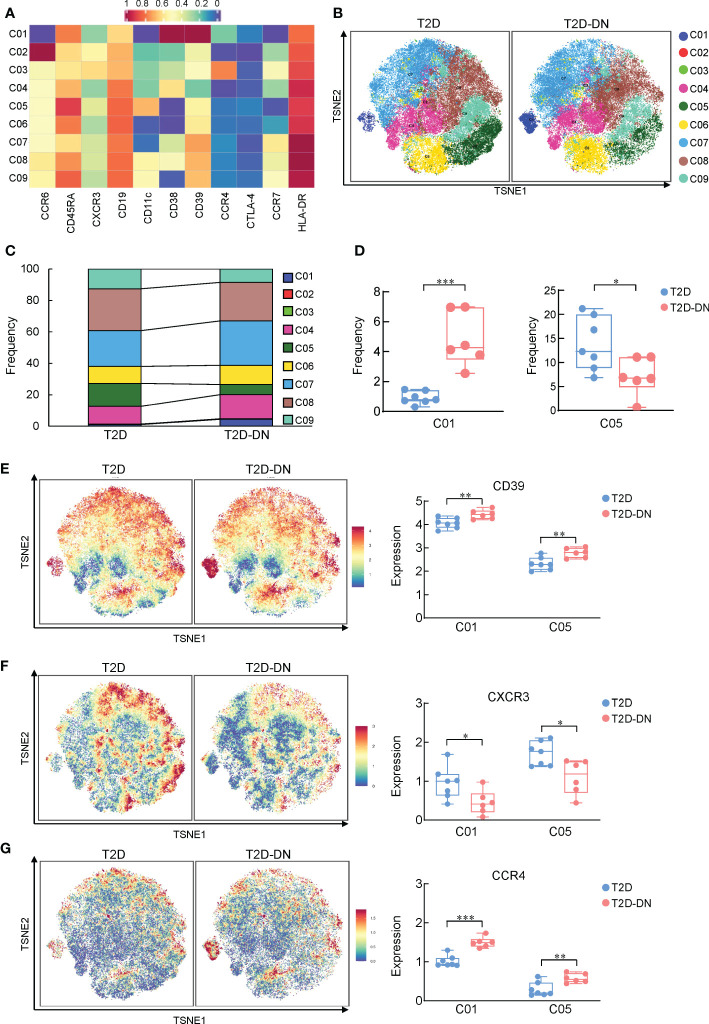
Diabetic nephropathy (DN) is the most prominent cause of chronic kidney disease and end-stage renal failure. However, the pathophysiology of DN, especially the risk factors for early onset remains elusive. Increasing evidence has revealed the role of the innate immune system in developing DN, but relatively little is known about early immunological change that proceeds from overt DN. Herein, this work aims to investigate the immune-driven pathogenesis of DN using mass cytometry (CyTOF). The peripheral blood mononuclear lymphocytes (PBMC) from 6 patients with early-stage nephropathy and 7 type II diabetes patients without nephropathy were employed in the CyTOF test. A panel that contains 38 lineage markers was designed to monitor immune protein levels in PBMC. The unsupervised clustering analysis was performed to profile the proportion of individual cells. t-Distributed Stochastic Neighbor Embedding (t-SNE) was used to visualize the differences in DN patients' immune phenotypes. Comprehensive immune profiling revealed substantial immune system alterations in the early onset of DN, including the significant decline of B cells and the marked increase of monocytes. The level of CXCR3 was dramatically reduced in the different immune cellular subsets. The CyTOF data classified the fine-grained differential immune cell subsets in the early stage of DN. Innovatively, we identified several significant changed T cells, B cell, and monocyte subgroups in the early-stage DN associated with several potential biomarkers for developing DN, such as CTLA-4, CXCR3, PD-1, CD39, CCR4, and HLA-DR. Correlation analysis further demonstrated the robust relationship between above immune cell biomarkers and clinical parameters in the DN patients. Therefore, we provided a convincible view of understanding the immune-driven early pathogenesis of DN. Our findings exhibited that patients with DN are more susceptible to immune system disorders. The classification of fine-grained immune cell subsets in this present research might provide novel targets for the immunotherapy of DN.
Keywords: diabetic nephropathy; high-dimensional mass cytometry; immune disorder; peripheral blood mononuclear cell (PBMC); type II diabetes mellitus.
Copyright © 2023 Jin, Wang, Liu, He, Zheng, Ni and He.
Conflict of interest statement
The authors declare that the research was conducted in the absence of any commercial or financial relationships that could be construed as a potential conflict of interest.
Figures


Similar articles
-
Mass cytometry reveals the corneal immune cell changes at single cell level in diabetic mice.Front Endocrinol (Lausanne). 2023 Sep 5;14:1253188. doi: 10.3389/fendo.2023.1253188. eCollection 2023. Front Endocrinol (Lausanne). 2023. PMID: 37732130 Free PMC article.
-
Immunological insights into role of Th9 and Treg cell homeostasis and cytokines dynamics in the progression of diabetic nephropathy.Int Rev Immunol. 2025 Jun 12:1-25. doi: 10.1080/08830185.2025.2515836. Online ahead of print. Int Rev Immunol. 2025. PMID: 40501365
-
Review of early circulating biomolecules associated with diabetes nephropathy - Ideal candidates for early biomarker array test for DN.Diabetes Res Clin Pract. 2021 Dec;182:109122. doi: 10.1016/j.diabres.2021.109122. Epub 2021 Nov 3. Diabetes Res Clin Pract. 2021. PMID: 34742785 Review.
-
Increased levels of inflammatory mediators and proinflammatory monocytes in patients with type I diabetes mellitus and nephropathy.J Diabetes Complications. 2017 Jan;31(1):245-252. doi: 10.1016/j.jdiacomp.2016.06.029. Epub 2016 Jul 5. J Diabetes Complications. 2017. PMID: 27452162
-
Role of Dendritic Cell in Diabetic Nephropathy.Int J Mol Sci. 2021 Jul 14;22(14):7554. doi: 10.3390/ijms22147554. Int J Mol Sci. 2021. PMID: 34299173 Free PMC article. Review.
Cited by
-
The Role of Immune Cells in DKD: Mechanisms and Targeted Therapies.J Inflamm Res. 2024 Apr 6;17:2103-2118. doi: 10.2147/JIR.S457526. eCollection 2024. J Inflamm Res. 2024. PMID: 38601771 Free PMC article. Review.
-
Editorial: Advances in the research of diabetic nephropathy, volume II.Front Endocrinol (Lausanne). 2023 Jan 18;14:1135265. doi: 10.3389/fendo.2023.1135265. eCollection 2023. Front Endocrinol (Lausanne). 2023. PMID: 36742377 Free PMC article. No abstract available.
-
Mass cytometry reveals the corneal immune cell changes at single cell level in diabetic mice.Front Endocrinol (Lausanne). 2023 Sep 5;14:1253188. doi: 10.3389/fendo.2023.1253188. eCollection 2023. Front Endocrinol (Lausanne). 2023. PMID: 37732130 Free PMC article.
-
A potential defensive role of TIM-3 on T lymphocytes in the inflammatory involvement of diabetic kidney disease.Front Immunol. 2024 May 15;15:1365226. doi: 10.3389/fimmu.2024.1365226. eCollection 2024. Front Immunol. 2024. PMID: 38812511 Free PMC article.
-
The causal effect of inflammatory proteins and immune cell populations on diabetic nephropathy: evidence from Mendelian randomization.Int Urol Nephrol. 2024 Aug;56(8):2769-2778. doi: 10.1007/s11255-024-04017-5. Epub 2024 Mar 23. Int Urol Nephrol. 2024. PMID: 38520496
References
Publication types
MeSH terms
Substances
LinkOut - more resources
Full Text Sources
Medical
Research Materials