. 2023 Jan 6:13:1088732.
doi: 10.3389/fphar.2022.1088732. eCollection 2022.

Comprehensive analysis of hypoxia-related genes for prognosis value, immune status, and therapy in osteosarcoma patients

Affiliations

Comprehensive analysis of hypoxia-related genes for prognosis value, immune status, and therapy in osteosarcoma patients

Tao Han et al. Front Pharmacol. .

Abstract

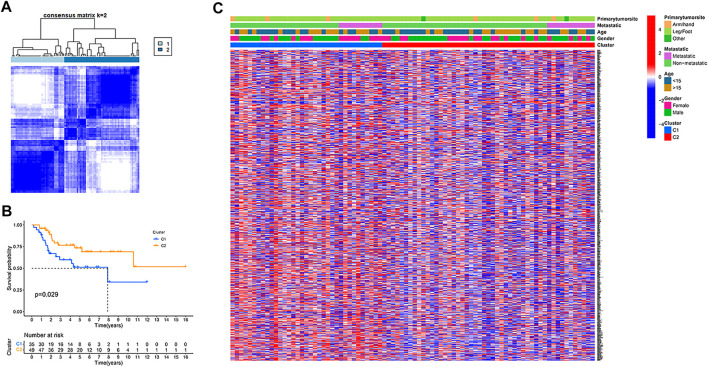
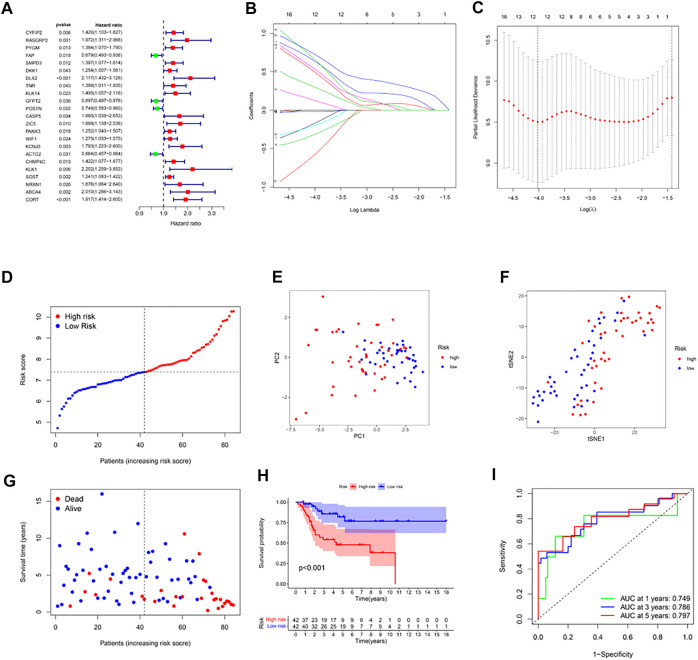
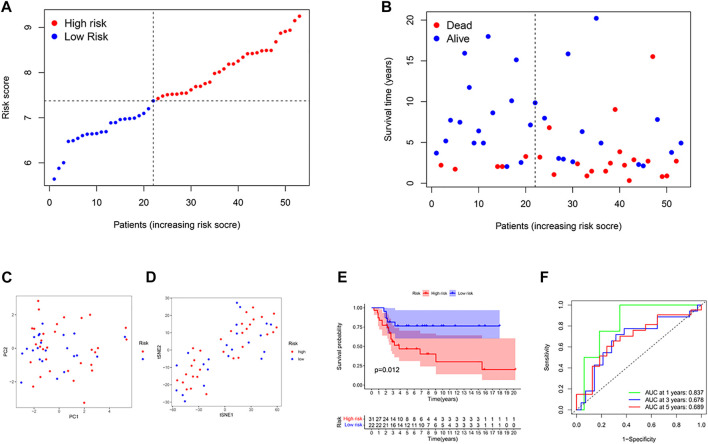
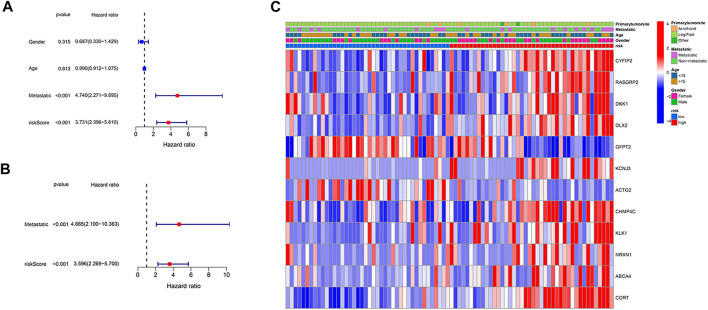
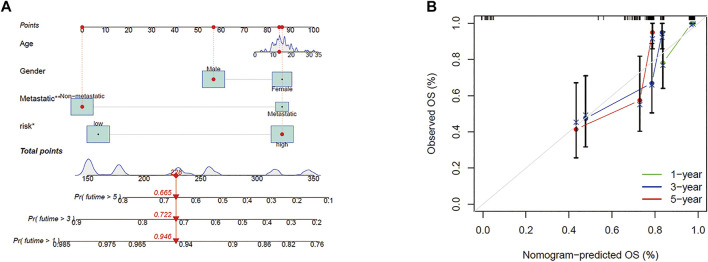
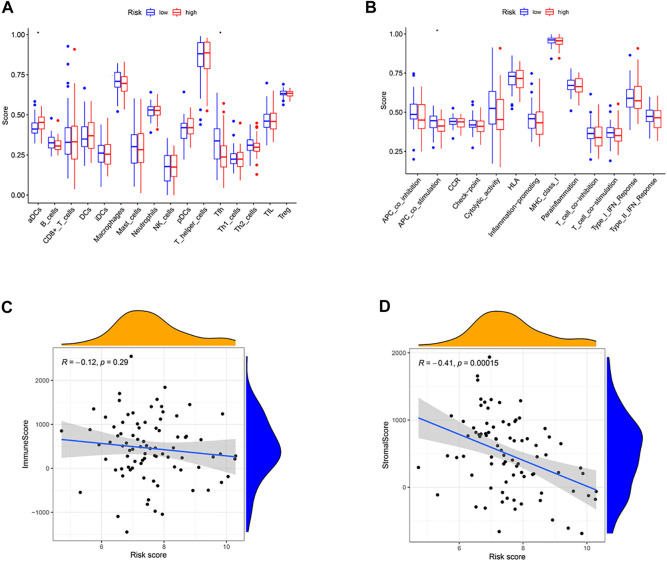
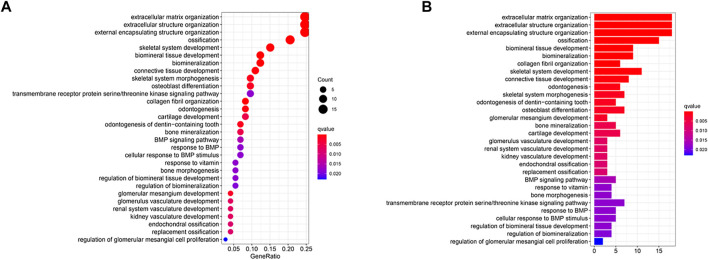
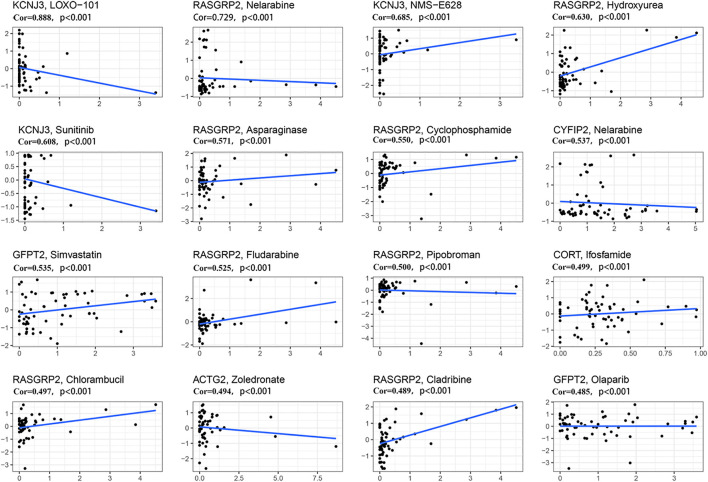
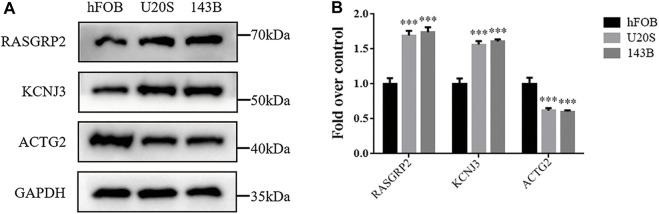
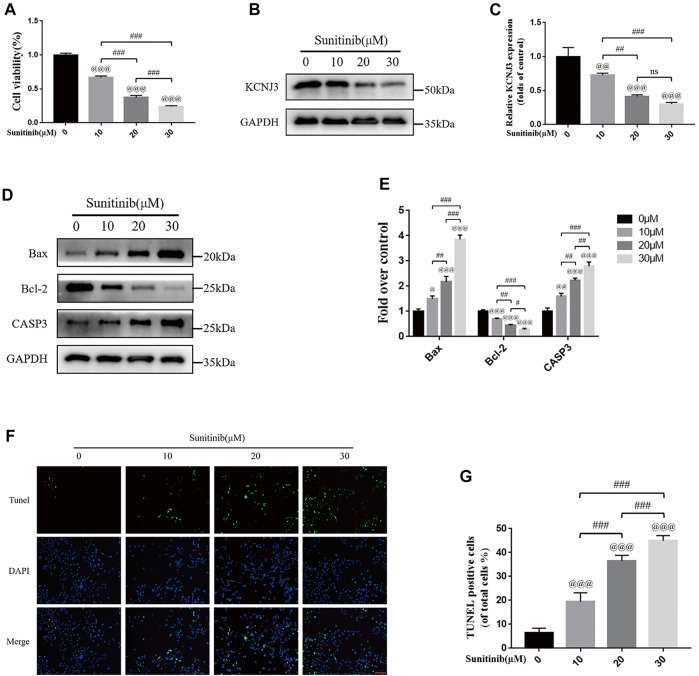
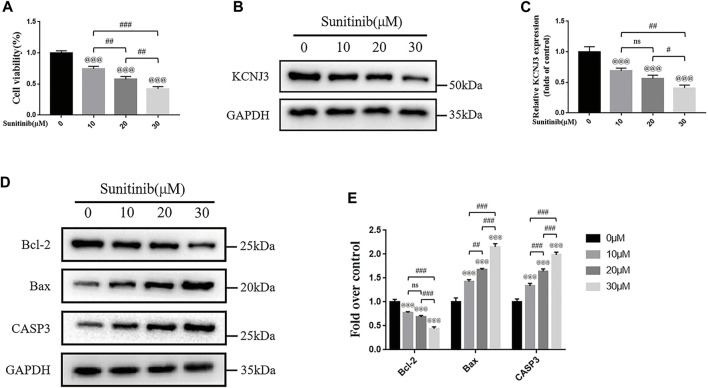
Osteosarcoma is a common malignant bone tumor in children and adolescents. The overall survival of osteosarcoma patients is remarkably poor. Herein, we sought to establish a reliable risk prognostic model to predict the prognosis of osteosarcoma patients. Patients ' RNA expression and corresponding clinical data were downloaded from the Therapeutically Applicable Research to Generate Effective Treatments (TARGET) and Gene Expression Omnibus databases. A consensus clustering was conducted to uncover novel molecular subgroups based on 200 hypoxia-linked genes. A hypoxia-risk models were established by Cox regression analysis coupled with LASSO regression. Functional enrichment analysis, including Gene Ontology annotation and KEGG pathway analysis, were conducted to determine the associated mechanisms. Moreover, we explored relationships between the risk scores and age, gender, tumor microenvironment, and drug sensitivity by correlation analysis. We identified two molecular subgroups with significantly different survival rates and developed a risk model based on 12 genes. Survival analysis indicated that the high-risk osteosarcoma patients likely have a poor prognosis. The area under the curve (AUC) value showed the validity of our risk scoring model, and the nomogram indicates the model's reliability. High-risk patients had lower Tfh cell infiltration and a lower stromal score. We determined the abnormal expression of three prognostic genes in osteosarcoma cells. Sunitinib can promote osteosarcoma cell apoptosis with down-regulation of KCNJ3 expression. In summary, the constructed hypoxia-related risk score model can assist clinicians during clinical practice for osteosarcoma prognosis management. Immune and drug sensitivity analysis can provide essential insights into subsequent mechanisms. KCNJ3 may be a valuable prognostic marker for osteosarcoma development.

Keywords: KCNJ3; chemotherapy; hypoxia; immune microenvironment; osteosarcoma; prognostic model; subtype.


Conflict of interest statement

The authors declare that the research was conducted in the absence of any commercial or financial relationships that could be construed as a potential conflict of interest.

Figures

FIGURE 1
FIGURE 1
Tumour classification based on the hypoxia-related genes. (A) 84 osteosarcoma patients were grouped into two clusters according to the consensus clustering matrix (k = 2). (B) Kaplan–Meier overall survival curves for the two clusters. (C) A heatmap (blue: low expression level; red: high expression level) for the connections between clinicopathologic features and the clusters.
FIGURE 2
FIGURE 2
Construction of risk signature in the TARGET cohort. (A) Univariate cox regression analysis of overall survival for each hypoxia-related gene, and 23 genes with p < .05. (B) LASSO regression of the 12 overall survival-related genes. (C) Cross-validation for tuning the parameter selection in the LASSO regression. (D) Distribution of patients based on the risk score. (E) PCA plot for osteosarcoma based on the risk score. (F) The t-SNE analysis based on the risk score. (G) The survival status for each patient (left side of the dotted line: low-risk population; right side of the dotted line: high-risk population). (H) Kaplan–Meier curves for the overall survival of patients between the high- and low-risk groups. (I) ROC curves demonstrated the predictive efficiency of the risk score.
FIGURE 3
FIGURE 3
Validation of the risk model in the GEO cohort. (A) Distribution of patients in the GEO cohort based on the median risk score of the TARGET cohort. (B) The survival status for each patient (left side of the dotted line: low-risk population; right side of the dotted line: high-risk population). (C) The PCA plot for osteosarcoma. (D) The t-SNE analysis based on the risk score. (E) Kaplan–Meier curves for comparison of the overall survival between low- and high-risk groups. (F) Time-dependent ROC curves for osteosarcoma.
FIGURE 4
FIGURE 4
Independence detection of the constructed risk prediction model. (A) Univariate analysis for the TARGET cohort. (B) Multivariate analysis for the TARGET cohort. (C) A heatmap (blue: low expression; red: high expression) for the connections between clinicopathologic features and the risk groups.
FIGURE 5
FIGURE 5
Construction of the predictive model. (A) A prognostic model to predict overall survival in the TARGET cohort. (B) Calibration curves of the OS nomogram model in the TARGET set.
FIGURE 6
FIGURE 6
Immune status between different risk groups and the association between risk score and tumor microenvironment. (A) Comparison of the enrichment scores of 16 types of immune cells between low- (blue box) and high-risk (red box) group in the TARGET cohort. (B) Comparison of the enrichment scores of 13 types of immune functions between low- (blue box) and high-risk (red box) group in the TARGET cohort. (C) The relationship between risk score and immune score. (D) The relationship between risk score and stromal score. (*p < .05).
FIGURE 7
FIGURE 7
Functional analysis based on the DEGs between the two-risk groups in the TARGET cohort. (A) Bubble graph for GO enrichment (the bigger bubble means the more genes enriched, and the increasing depth of red means the differences were more obvious; q-value: the adjusted p-value). (B) Barplot graph for KEGG pathways (the longer bar means the more genes enriched, and the increasing depth of red means the differences were more obvious).
FIGURE 8
FIGURE 8
Scatter plot of relationship between prognostic gene expression and drug sensitivity. The top 16 correlation analyses are shown based on the p-value. The horizontal axis represents the gene expression; The vertical axis represents changes in gene expression after administration.
FIGURE 9
FIGURE 9
The expression levels of three hypoxia-related genes between osteosarcoma cell lines and osteoblasts. (A) Western blotting of the expressions of RASGRP2, KCNJ3, and ACTG2 in hFOB, U20S, and 143B groups. GAPDH serves as an internal standard. The gels have been run under the same experimental conditions. (B) A histogram of the OD values of RASGRP2, KCNJ3, and ACTG2 in each group (n = 3 per group). The obtained data are represented as mean ± SE. Significance: ***p-value < .001, vs. hFOB group.
FIGURE 10
FIGURE 10
Sunitinib can decrease KCNJ3 expression and enhance apoptosis in U20S osteosarcoma cells. (A) Evaluation of U20S osteosarcoma cell viability using CCK-8 assay after exposure to various concentrations of sunitinib for 24 h. (B,C) The expression level of KCNJ3 protein of osteosarcoma cells in control and sunitinib treatment groups. (D,E) The protein expression levels of Bax, Bcl-2, and caspase3 in osteosarcoma cells in the sham (0μM) and sunitinib treatment groups. (F,G) TUNEL staining was used to detect osteosarcoma cell apoptosis after sunitinib treatment (bar: 50 μm; nuclei: blue; positive cells: green). All experiments were repeated in triplicates (n = 3). The obtained data are represented as mean ± SE. Significance: @ p-value < .05, @@ p-value < .01, @@@ p-value < .001, vs. sham (0 μM) group. # p-value < .05, ## p-value < .01, ### p-value < .001.
FIGURE 11
FIGURE 11
Sunitinib promotes apoptosis in 143B osteosarcoma cells with decreased expression of KCNJ3. (A) 143B osteosarcoma cell viability evaluation via CCK-8 assay. (B,C) The expression level of KCNJ3 protein. (D,E) The protein expression levels of Bcl-2, Bax, and caspase3. All experiments were repeated in triplicates (n = 3). The obtained data are represented as mean ± SE. Significance: @@@ p-value < .001, vs. sham (0 μM) group. # p-value < .05, ## p-value < .01, ### p-value < .001.

Similar articles

Cited by

References

    1. Avgeris M., Mavridis K., Scorilas A. (2012). Kallikrein-related peptidases in prostate, breast, and ovarian cancers: From pathobiology to clinical relevance. Biol. Chem. 393 (5), 301–317. 10.1515/hsz-2011-0260 - DOI - PubMed
    1. Casali P. G., Bielack S., Abecassis N., Aro H. T., Bauer S., Biagini R., et al. (2018). Bone sarcomas: ESMO-PaedCan-EURACAN clinical practice guidelines for diagnosis, treatment and follow-up. Ann. Oncol. 29 (4), iv79–iv95. 10.1093/annonc/mdy310 - DOI - PubMed
    1. Chen J., Yang C., Yang Y., Liang Q., Xie K., Liu J., et al. (2021). Targeting DKK1 prevents development of alcohol-induced osteonecrosis of the femoral head in rats. Am. J. Transl. Res. 13 (4), 2320–2330. - PMC - PubMed
    1. Duan X. L., Guo J. P., Li F., Xiu C., Wang H. (2020). Sunitinib inhibits PD-L1 expression in osteosarcoma by targeting STAT3 and remodels the immune system in tumor-bearing mice. Future Oncol. 16 (24), 1815–1824. 10.2217/fon-2019-0725 - DOI - PubMed
    1. Feng P., Li Z., Li Y., Zhang Y., Miao X. (2022). Characterization of different subtypes of immune cell infiltration in glioblastoma to aid immunotherapy. Front. Immunol. 13, 799509. 10.3389/fimmu.2022.799509 - DOI - PMC - PubMed

LinkOut - more resources