

Separate and combined effects of advanced age and obesity on mammary adipose inflammation, immunosuppression and tumor progression in mouse models of triple negative breast cancer
- PMID: 36686775
- PMCID: PMC9846347
- DOI: 10.3389/fonc.2022.1031174
Separate and combined effects of advanced age and obesity on mammary adipose inflammation, immunosuppression and tumor progression in mouse models of triple negative breast cancer
Abstract
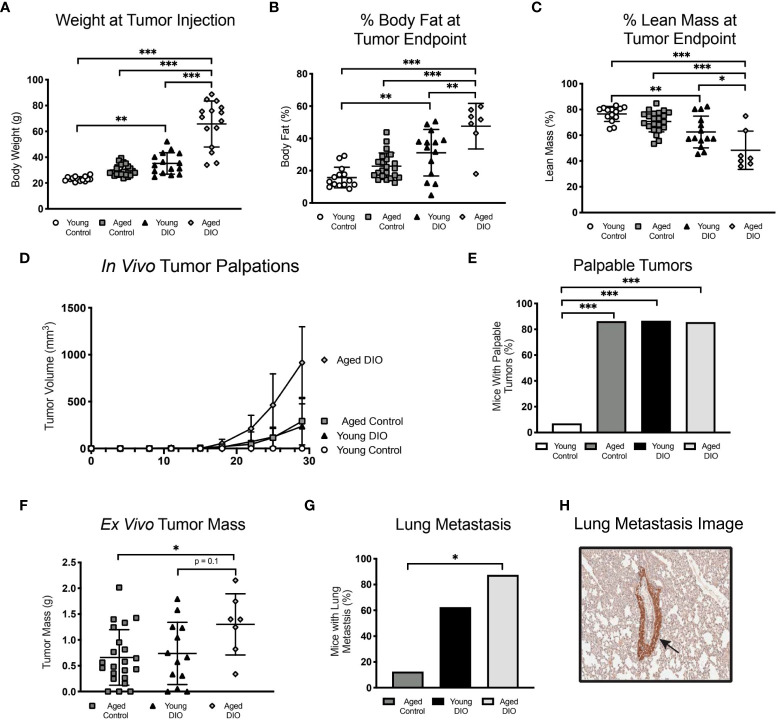
Introduction: Advanced age and obesity are independent risk and progression factors for triple negative breast cancer (TNBC), which presents significant public health concerns for the aging population and its increasing burden of obesity. Due to parallels between advanced age- and obesityrelated biology, particularly adipose inflammation, we hypothesized that advanced age and obesity each accelerate mammary tumor growth through convergent, and likely interactive, mechanisms.
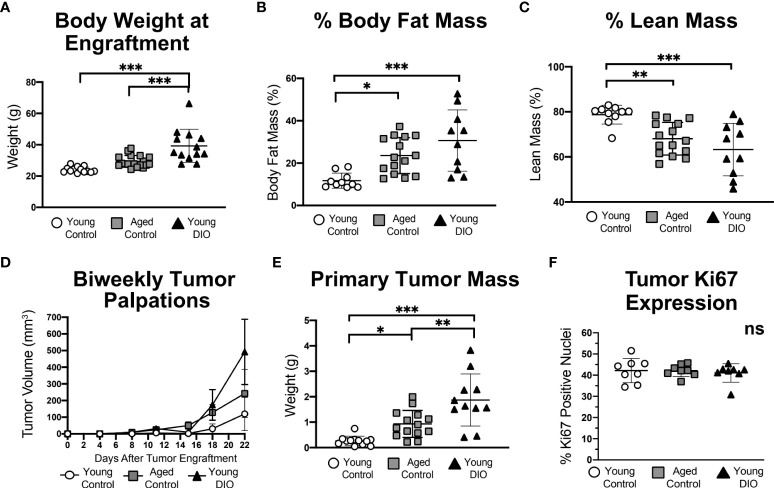
Methods: To test this hypothesis, we orthotopically transplanted murine syngeneic TNBC cells into the mammary glands of young normoweight control (7 months), young diet-induced obese (DIO), aged normoweight control (17 months), and aged DIO female C57BL/6J mice.
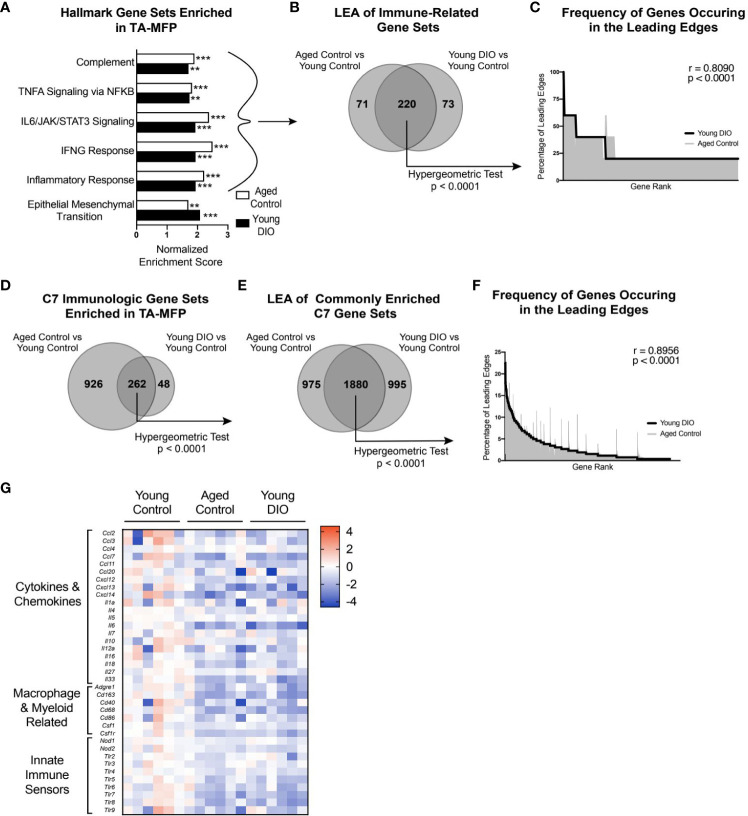
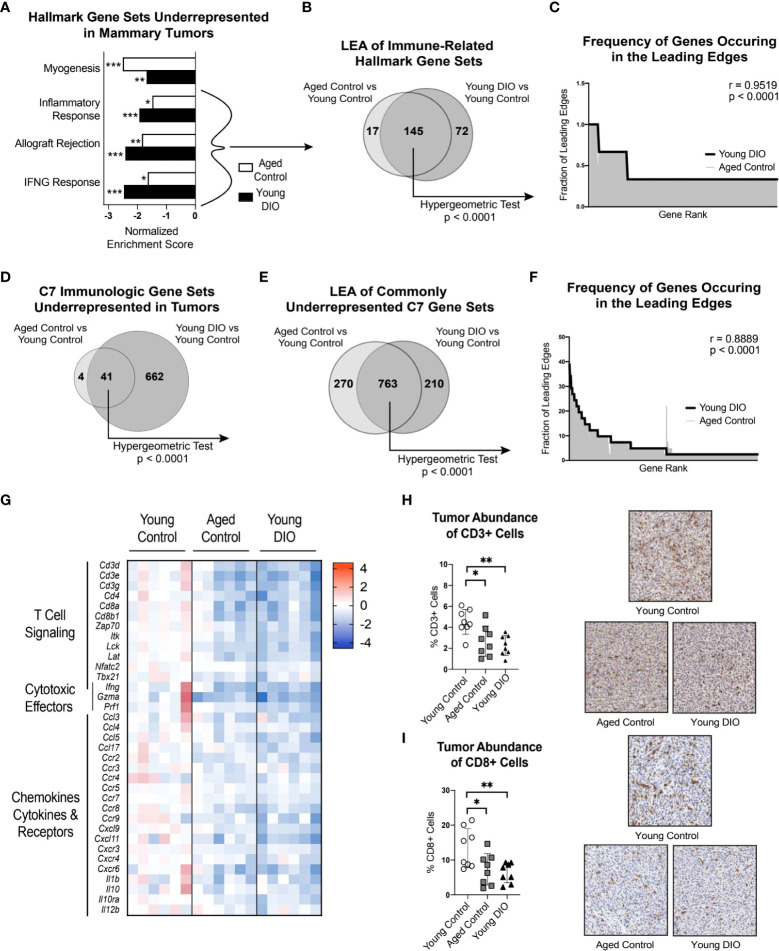
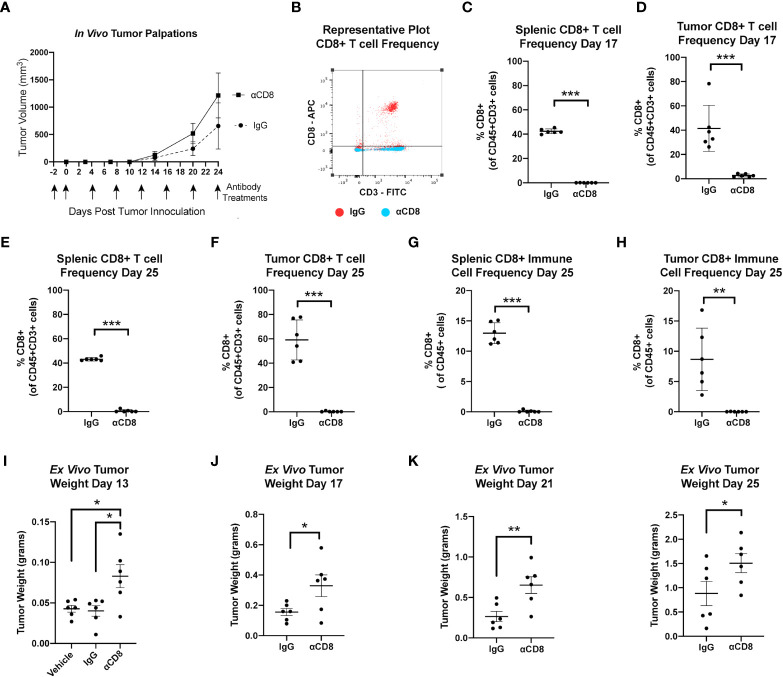
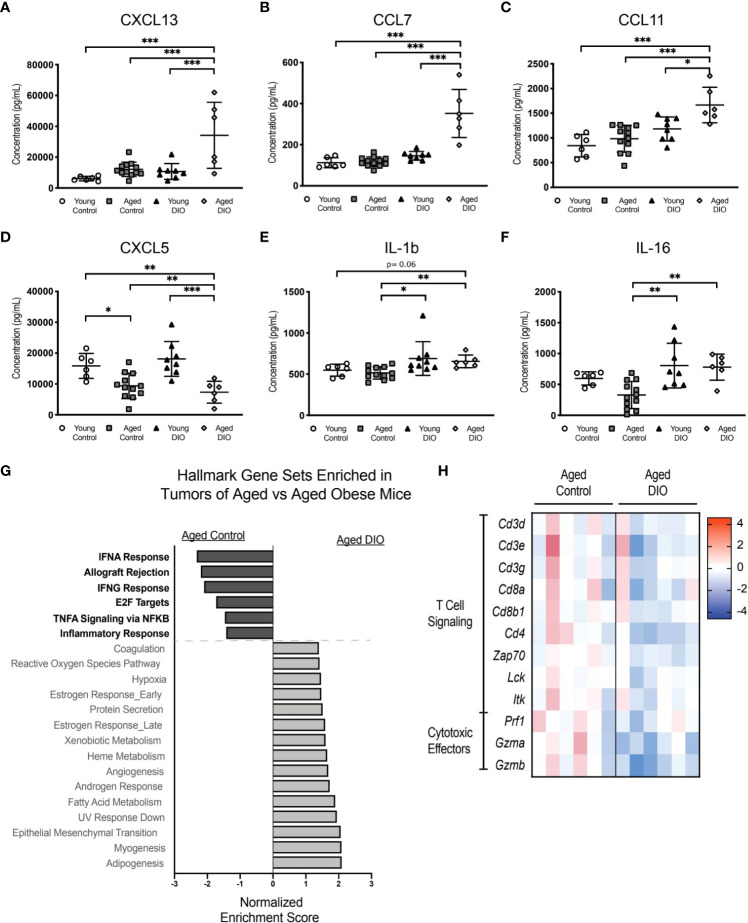
Results: Here we report accelerated tumor growth in aged control and young DIO mice, compared with young controls. Transcriptional analyses revealed, with a few exceptions, overlapping patterns of mammary tumor inflammation and tumor immunosuppression in aged control mice and young DIO mice, relative to young controls. Moreover, aged control and young DIO tumors, compared with young controls, had reduced abundance ofcytotoxic CD8 T cells. Finally, DIO in advanced age exacerbated mammary tumor growth, inflammation and tumor immunosuppression.
Discussion: These findings demonstrate commonalities in the mechanisms driving TNBC in aged and obese mice, relative to young normoweight controls. Moreover, we found that advanced age and DIO interact to accelerate mammary tumor progression. Given the US population is getting older and more obese, age- and obesity-related biological differences will need to be considered when developing mechanism-based strategies for preventing or controlling breast cancer.
Keywords: advanced age; breast cancer; inflammation; obesity; tumor immunosuppression.
Copyright © 2023 Smith, Craven, Rainey, Cozzo, Carson, Glenny, Sheth, McDonell, Rezeli, Montgomery, Bowers, Coleman and Hursting.
Conflict of interest statement
The authors declare that the research was conducted in the absence of any commercial or financial relationships that could be construed as a potential conflict of interest.
Figures
Similar articles
-
Resveratrol inhibits obesity-associated adipose tissue dysfunction and tumor growth in a mouse model of postmenopausal claudin-low breast cancer.Mol Carcinog. 2018 Mar;57(3):393-407. doi: 10.1002/mc.22763. Epub 2017 Dec 1. Mol Carcinog. 2018. PMID: 29197120 Free PMC article.
-
Omega-3-Acid Ethyl Esters Block the Protumorigenic Effects of Obesity in Mouse Models of Postmenopausal Basal-like and Claudin-Low Breast Cancer.Cancer Prev Res (Phila). 2015 Sep;8(9):796-806. doi: 10.1158/1940-6207.CAPR-15-0018. Epub 2015 Jun 22. Cancer Prev Res (Phila). 2015. PMID: 26100521 Free PMC article.
-
Obesity-Associated Alterations in Inflammation, Epigenetics, and Mammary Tumor Growth Persist in Formerly Obese Mice.Cancer Prev Res (Phila). 2016 May;9(5):339-48. doi: 10.1158/1940-6207.CAPR-15-0348. Epub 2016 Feb 11. Cancer Prev Res (Phila). 2016. PMID: 26869351 Free PMC article.
-
Leptin Signaling Mediates Obesity-Associated CSC Enrichment and EMT in Preclinical TNBC Models.Mol Cancer Res. 2018 May;16(5):869-879. doi: 10.1158/1541-7786.MCR-17-0508. Epub 2018 Feb 16. Mol Cancer Res. 2018. PMID: 29453319 Free PMC article.
-
Contribution of the tumor and obese microenvironment to triple negative breast cancer.Cancer Lett. 2021 Jul 1;509:115-120. doi: 10.1016/j.canlet.2021.03.024. Epub 2021 Mar 30. Cancer Lett. 2021. PMID: 33798632 Review.
Cited by
-
Weight Loss Reverses the Effects of Aging and Obesity on Mammary Tumor Immunosuppression and Progression.Cancer Prev Res (Phila). 2025 Aug 1;18(8):453-463. doi: 10.1158/1940-6207.CAPR-24-0514. Cancer Prev Res (Phila). 2025. PMID: 40231562
-
Obesity-associated epigenetic alterations and the obesity-breast cancer axis.Oncogene. 2024 Mar;43(11):763-775. doi: 10.1038/s41388-024-02954-0. Epub 2024 Feb 3. Oncogene. 2024. PMID: 38310162 Review.
-
Calorie restriction outperforms bariatric surgery in a murine model of obesity and triple-negative breast cancer.JCI Insight. 2023 Sep 12;8(19):e172868. doi: 10.1172/jci.insight.172868. JCI Insight. 2023. PMID: 37698918 Free PMC article.
-
Glutathione peroxidase 4 (GPX4) and obesity interact to impact tumor progression and treatment response in triple negative breast cancer.Cancer Metab. 2025 Feb 25;13(1):11. doi: 10.1186/s40170-025-00380-8. Cancer Metab. 2025. PMID: 40001204 Free PMC article.
-
Proteogenomic characterization of invasive breast tumors in young women.NPJ Breast Cancer. 2025 Aug 18;11(1):94. doi: 10.1038/s41523-025-00793-0. NPJ Breast Cancer. 2025. PMID: 40826002 Free PMC article.
References
-
- World Cancer Research Fund International . Worldwide cancer data . Available at: https://www.wcrf.org/cancer-trends/worldwide-cancer-data/ (Accessed May 9, 2022).
-
- Hales CM, Carroll MD, Fryar CD, Ogden CL. Prevalence of obesity and severe obesity among adults: United States, 2017-2018. In: National Center for Health Statistics Brief. (Hyattsville, MD: National Center for Health Statistics; ) (2020). 360:1–8. - PubMed
Grants and funding
LinkOut - more resources
Full Text Sources
Research Materials