. 2023 Jan 4:12:1064223.
doi: 10.3389/fonc.2022.1064223. eCollection 2022.

Endoplasmic reticulum stress related IncRNA signature predicts the prognosis and immune response evaluation of uterine corpus endometrial carcinoma

Affiliations

Endoplasmic reticulum stress related IncRNA signature predicts the prognosis and immune response evaluation of uterine corpus endometrial carcinoma

Jun Chen et al. Front Oncol. .

Abstract

Background: Endoplasmic reticulum (ER) stress is closely related to the occurrence, development and treatment of tumors. Recent studies suggest ER stress as a therapeutic strategy of choice for cancer. However, ER stress-related long non-coding RNA (lncRNA) predictive value in endometrial carcinoma (UCEC) remains to be further evaluated. The purpose of this study was to establish relies on the signature of ER stress-related lncRNA forecast to predict the prognosis of patients with UCEC.

Methods: We downloaded the RNA expression profile dataset and matched clinical data from the Cancer Genome Atlas (TCGA) database, and applied univariate and multivariate Cox regression analysis to build predictive signature. Kaplan-meier method was used to evaluate overall survival (OS) and disease-free survival (DFS). Gene set enrichment analysis (GSEA) was used to study the functional characteristics. Single sample Gene set enrichment analysis (ssGSEA) was used to analyze the relationship between immune status and predicted signature. Correlations between the potential usefulness of treatment for UCEC patients and predictive signature were also analyzed.

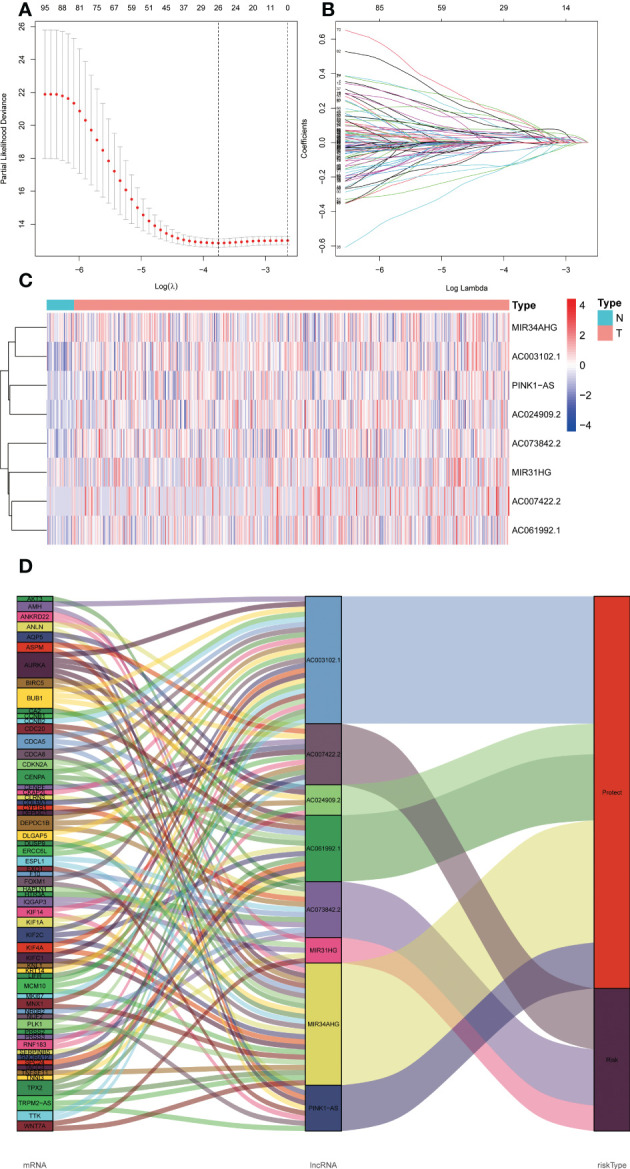
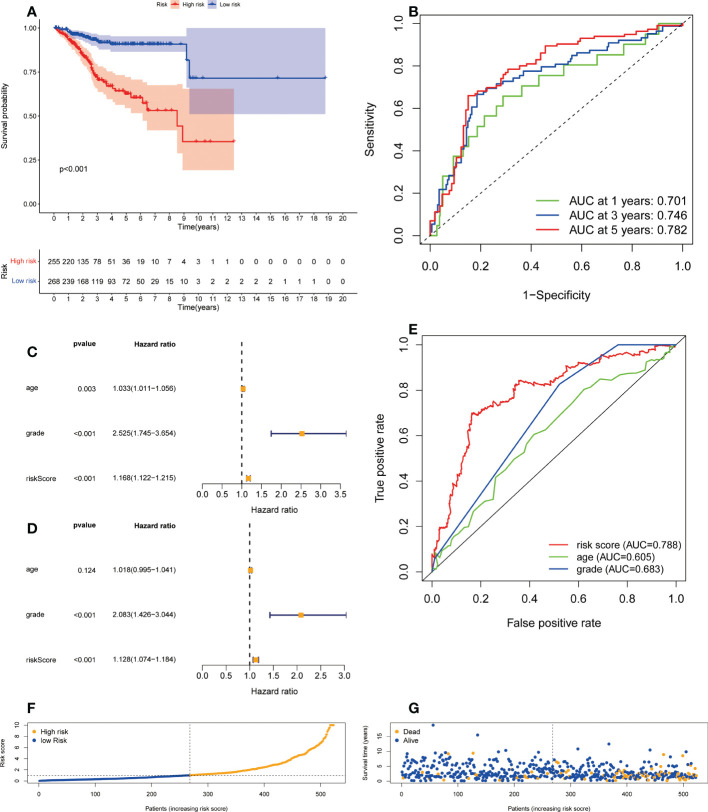
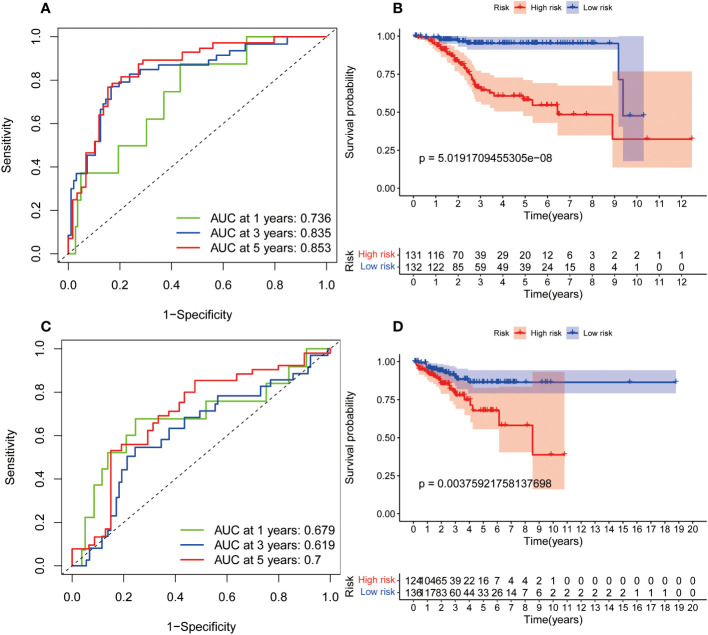
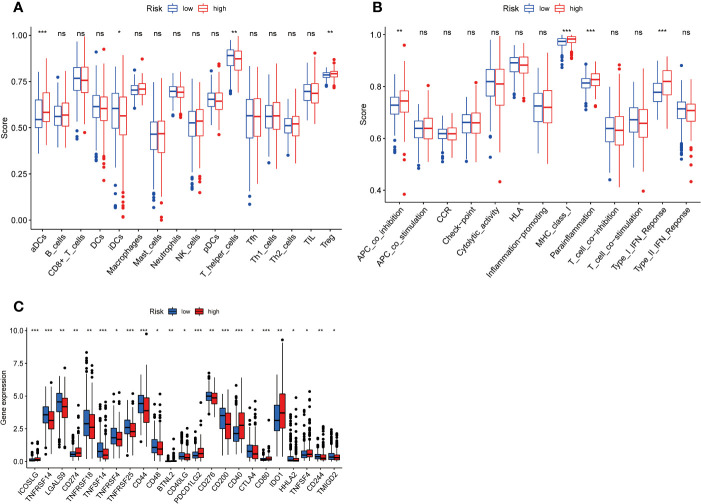
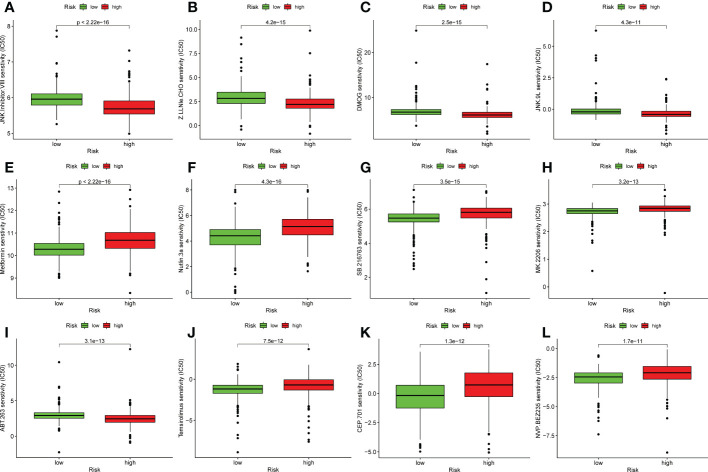
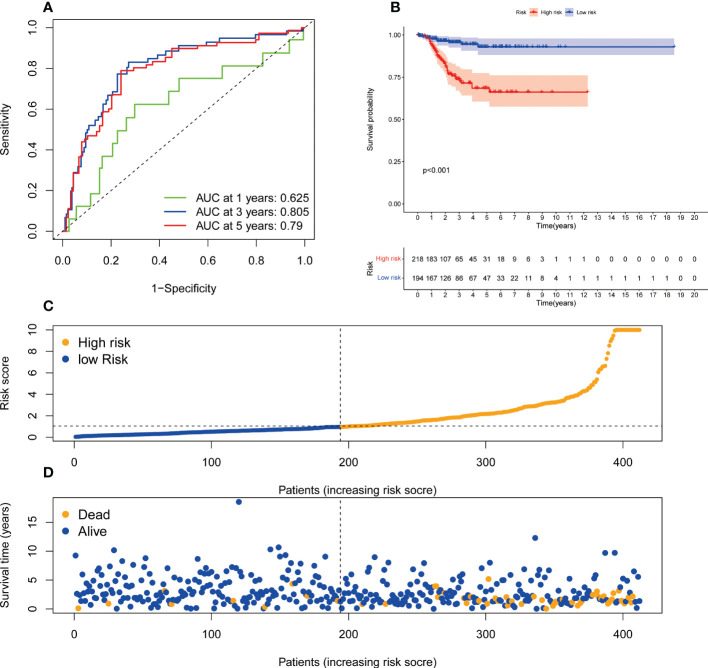
Results: We established a signature composed of eight ER stress-related lncRNAs (MIR34AHG, AC073842.2, PINK1AS, AC024909.2, MIR31HG, AC007422.2, AC061992.1, AC003102.1). The signature of ER stress-related lncRNA provided better diagnostic value compared with age and tumor grade, and the area under the receiver operating curve was 0.788. The overall and disease-free survival probability of patients in the high-risk group is lower than that in the low-risk group. GSEA indicated that the pathways were mainly enriched for cancer, immunity and reproduction related pathways. ss-GSEA shows that prediction signature and activation of dendritic cells, immature dendritic cells, T helper cells and immune status of the Treg are significantly related. High-risk groups may against PD - 1/L1 immunotherapy and JNK inhibitors VIII, Z.LLNle.CHO, DMOG and JNK. 9 l more sensitive.

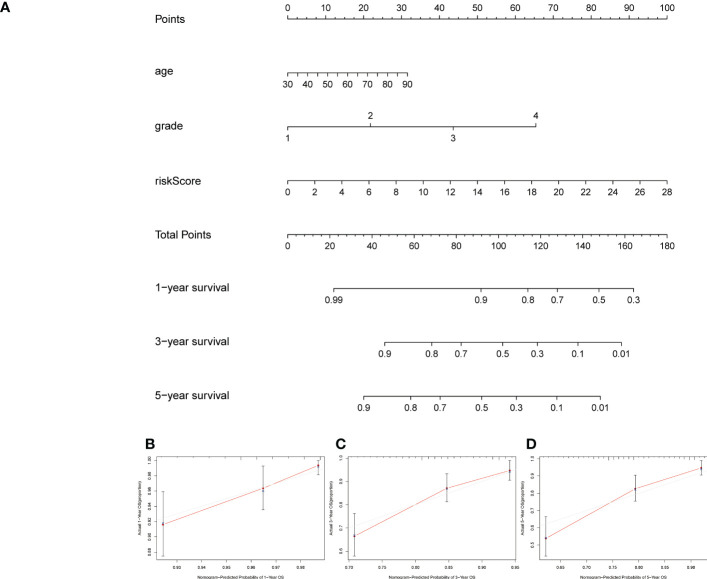
Conclusion: The ER stress signature can independently predict the prognosis of UCEC patients, and provide guidance for conventional chemotherapy and immunotherapy of UCEC patients.

Keywords: ER stress; drug therapy; immune infiltration; lncRNAs; uterine corpus endometrial carcinoma.


Conflict of interest statement

The authors declare that the research was conducted in the absence of any commercial or financial relationships that could be construed as a potential conflict of interest.

Figures

Figure 1
Figure 1
KEGG and GO analyses of endoplasmic reticulum stress related DEGs in UCEC and adjacent tissues. (A) Volcano plot of 8763 endoplasmic reticulum stress related genes in UCEC. Blue dots represent downregulated genes and yellow dots represent up-regulated genes. (B) KEGG analysis of endoplasmic reticulum stress -related DEGs. (C) GO analysis of endoplasmic reticulum stress related DEGs. KEGG, Kyoto Encyclopedia of Genes and Genomes; GO, Gene Ontology; DEGs, differentially expressed genes; fdr, false discovery rate; FC, fold change; BP, biological process; CC, cellular components; MF, molecular function.
Figure 2
Figure 2
The expression levels and lncRNA-mRNA network of eight endoplasmic reticulum stress -related lncRNAs in the predictive signature. (A, B) Lasson regression establishes signature and divides TCGA dataset into training set and validation set. (C) The heatmap of expression levels with eight endoplasmic reticulum stress -related lncRNAs in UCEC and normal tissues. (D) Sankey diagram of prognostic endoplasmic reticulum stress -related lncRNAs. lncRNAs, long noncoding RNAs; UCEC, Uterine Corpus Endometrial Carcinoma; T, tumor; N, normal.
Figure 3
Figure 3
The correlation between the predictive signature and the prognosis of UCEC patients. (A) Kaplan-Meier analysis of the OS rate of UCEC patients between the high and low-risk groups. (B) The ROC curve and AUCs at one-year, three-years and five-years survival for the predictive signature. (C) Forest plot for univariate Cox regression analysis. (D) Forest plot for multivariate Cox regression analysis. (E) The ROC curve and AUCs of the risk score, age and grade. (F) The number of dead and alive patients with different risk scores. Blue represents the number of alive, and yellow represents the number of dead. (G) The distribution of the risk score in UCEC patients. UCEC, Uterine Corpus Endometrial Carcinoma; OS, overall survival; ROC, receiver operating curve; AUC, area under the curve.
Figure 4
Figure 4
Creation and verification of the nomogram. (A) A nomogram integrating age, grade and risk score to predict 1-, 3-, and 5-year OS for UCEC patients. (B–D) Calibration curves tested the agreement between actual OS rates and predicted 1-, 3-, and 5-year survival rates. OS, overall survival.
Figure 5
Figure 5
The internal verification of the predictive signature for OS relied on TCGA-UCEC data. (A) The ROC curve at 1-, 3-, and 5-year survival based on internal training cohort. (B) Kaplan-Meier survival curve in internal training cohort. (C) The ROC curve at 1-, 3-, and 5-year survival based on internal validation cohort. (D) Kaplan-Meier survival curve in internal validation cohort. ROC, receiver operating curve; AUC, area under the curve; OS, overall survival; TCGA, The Cancer Genome Atlas.
Figure 6
Figure 6
Figure 6 Immune infiltrating cell scores, immune-related functions, and immune checkpoint gene profiles in high-risk and low-risk populations. (A) Differences in infiltration of 16 immune cells between highrisk and low-risk groups were calculated using the ssGSEA algorithm. (B) Correlations of 13 immune-related functions with predictive signature in high- and low-risk populations. (C) Expression of immune checkpoint genes in high-risk and low-risk populations. ssGSEA, single sample gene set enrichment analysis; aDCs, activated dendritic cells; iDCs, immature dendritic cells; NK, natural killer; pDCs, plasmacytoid dendritic cells; Tfh, T follicularhelper; Th1, T helper type 1; Th2, T helper type 2; TIL, tumor-infiltrating lymphocyte; Treg, T regulatory cell; APC, antigen-presenting cell; CCR, chemokine receptor; HLA, human leukocyte antigen; MHC, major histocompatibility complex. *p < 0.05; **p < 0.01; ***p < 0.001; ns, non-significant.
Figure 7
Figure 7
Comparison of susceptibility to twelve therapeutic agents between high-risk and low-risk groups. (A) IC50 of JNK inhibitor VIII high and low risk groups. (B) IC50 of Z.LLNle.CHO high and low risk groups. (C) IC50 of DMOG in high and low risk groups. (D) IC50 of JNK.9L in high and low risk groups. (E) IC50 of Metformin in high and low risk groups. (F) IC50 of Nutlin.3a in high and low risk groups. (G) IC50 of SB.216763 in high and low risk groups. (H) IC50 of MK.2206 in high and low risk groups. (I) IC50 of ABT.263 in high and low risk groups. (J) IC50 of Temsirolimus in high and low risk groups. (K) IC50 of CEP.701 in high and low risk groups. (L) IC50 of NVP.BEZ235 in high and low risk groups.
Figure 8
Figure 8
The predictive value of endoplasmic reticulum stress -related lncRNA signature in DFS. (A) ROC curve at 1-, 3-, and 5-year survival based on TCGA-UCEC data. (B) Kaplan-Meier survival curve based on TCGA-UCEC data. (C) The number of dead and alive patients with different risk scores. Blue represents the number of alive, and yellow represents the number of dead. (D) The distribution of the risk score in UCEC patients. DFS, disease-free survival; ROC, receiver operating characteristic; AUC, area under the curve.

Similar articles

Cited by

References

    1. Liu J, Yin J, Wang Y, Cai L, Geng R, Du M, et al. A comprehensive prognostic and immune analysis of enhancer RNA identifies IGFBP7-AS1 as a novel prognostic biomarker in uterine corpus endometrial carcinoma. Biol Procedures Online. (2022) 24(1):9. doi: 10.1186/s12575-022-00172-0 - DOI - PMC - PubMed
    1. Barzilova VD, Drury J, Rogers B, Thomas E, Ahmed F, Bradfield A, et al. Role of nucleolin in endometrial precancerous hyperplasia and carcinogenesis: Ex vivo and in silico study. Int J Mol Sci (2022) 23(11):6228. doi: 10.3390/ijms23116228 - DOI - PMC - PubMed
    1. Park JY, Lee JY, Lee YY, Shim SH, Suh DH, Kim JW. Major clinical research advances in gynecologic cancer in 2021. J Gynecol Oncol (2022) 33(2):e43. doi: 10.3802/jgo.2022.33.e43 - DOI - PMC - PubMed
    1. Chino J, Damast S, Kidd E, Harkenrider M, Albuquerque K, Kamrava M. Radiation for cancers of the uterine corpus and cervix: Incremental steps, and glimmers of the future. Int J Radiat Oncol Biol Physics (2020) 108(4):839–45. doi: 10.1016/j.ijrobp.2020.06.012 - DOI - PubMed
    1. Yuan H, Zhao Z, Guo Z, Ma L, Han J, Song Y. A novel ER stress mediator TMTC3 promotes squamous cell carcinoma progression by activating GRP78/PERK signaling pathway. Int J Biol Sci (2022) 18(13):4853–68. doi: 10.7150/ijbs.72838 - DOI - PMC - PubMed