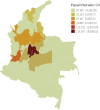
Multivariate analysis in data science for the geospatial distribution of the breast cancer mortality rate in Colombia
- PMID: 36686819
- PMCID: PMC9853892
- DOI: 10.3389/fonc.2022.1055655
Multivariate analysis in data science for the geospatial distribution of the breast cancer mortality rate in Colombia
Abstract
This research is framed in the area of biomathematics and contributes to the epidemiological surveillance entities in Colombia to clarify how breast cancer mortality rate (BCM) is spatially distributed in relation to the forest area index (FA) and circulating vehicle index (CV). In this regard, the World Health Organization has highlighted the scarce generation of knowledge that relates mortality from tumor diseases to environmental factors. Quantitative methods based on geospatial data science are used with cross-sectional information from the 2018 census; it's found that the BCM in Colombia is not spatially randomly distributed, but follows cluster aggregation patterns. Under multivariate modeling methods, the research provides sufficient statistical evidence in terms of not rejecting the hypothesis that if a spatial unit has high FA and low CV, then it has significant advantages in terms of lower BCM.
Keywords: breast cancer; data science; georeferencing; spatial clusters; spatial distribution.
Copyright © 2023 Rubio, Alfaro, Mejia-Giraldo, Fuertes, Mosquera and Vargas.
Conflict of interest statement
The authors declare that the research was conducted in the absence of any commercial or financial relationships that could be construed as a potential conflict of interest.
Figures


References
-
- Yan D, Cao H. The global dynamics for an age-structured tuberculosis transmission model with the exponential progression rate. Appl Math Model (2019) 75:769–86. doi: 10.1016/J.APM.2019.07.003 - DOI
-
- Diekmann O, Heesterbeek H, Britton T. Mathematical tools for understanding infectious disease dynamics. New Jersey: Princeton University Press; (2013).
LinkOut - more resources
Full Text Sources
Research Materials

