. 2023 Feb 17;26(2):105995.
doi: 10.1016/j.isci.2023.105995. Epub 2023 Jan 16.

SARS-CoV-2 N protein mediates intercellular nucleic acid dispersion, a feature reduced in Omicron

Affiliations

SARS-CoV-2 N protein mediates intercellular nucleic acid dispersion, a feature reduced in Omicron

Jung-Lin Wu et al. iScience. .

Abstract

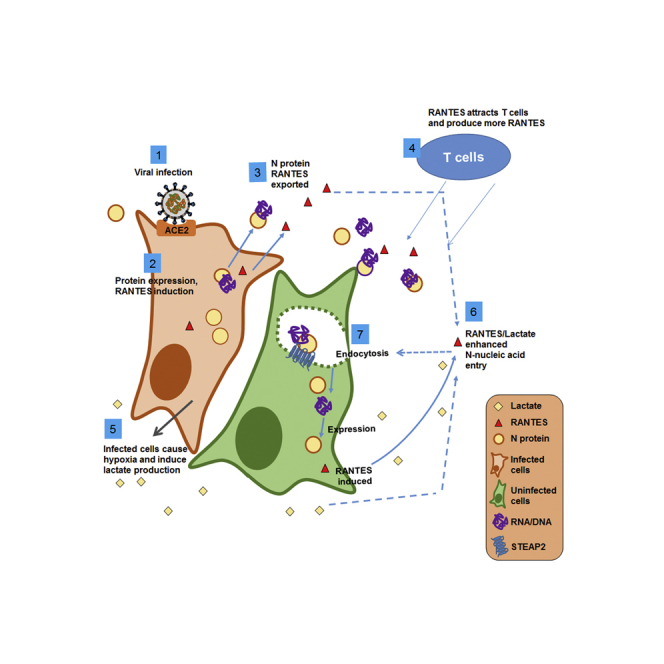
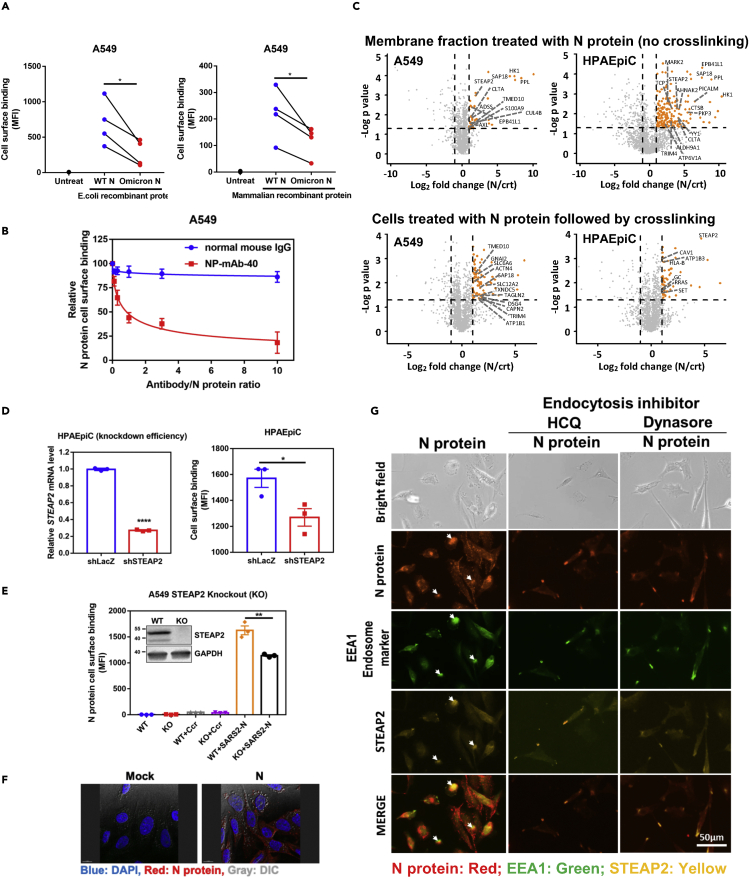
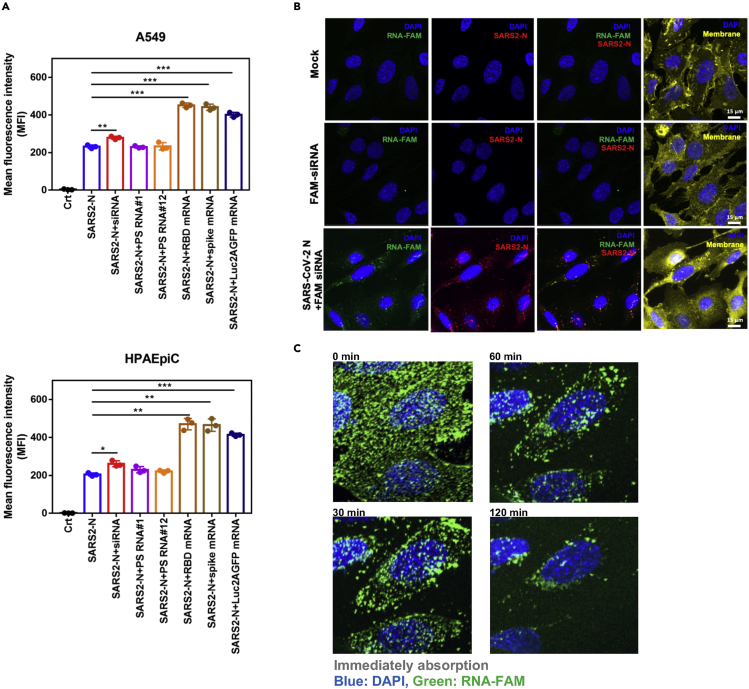
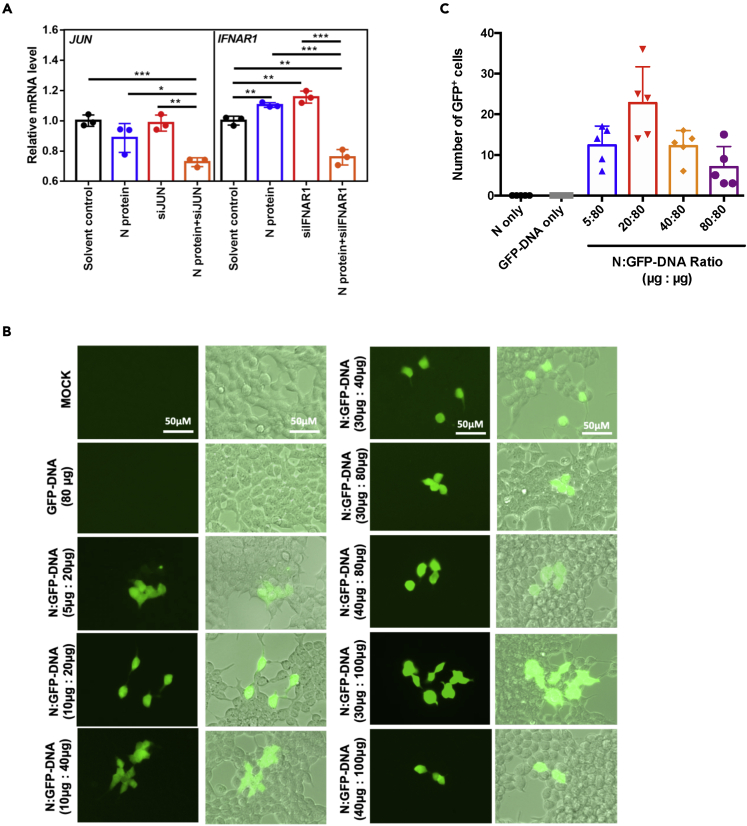
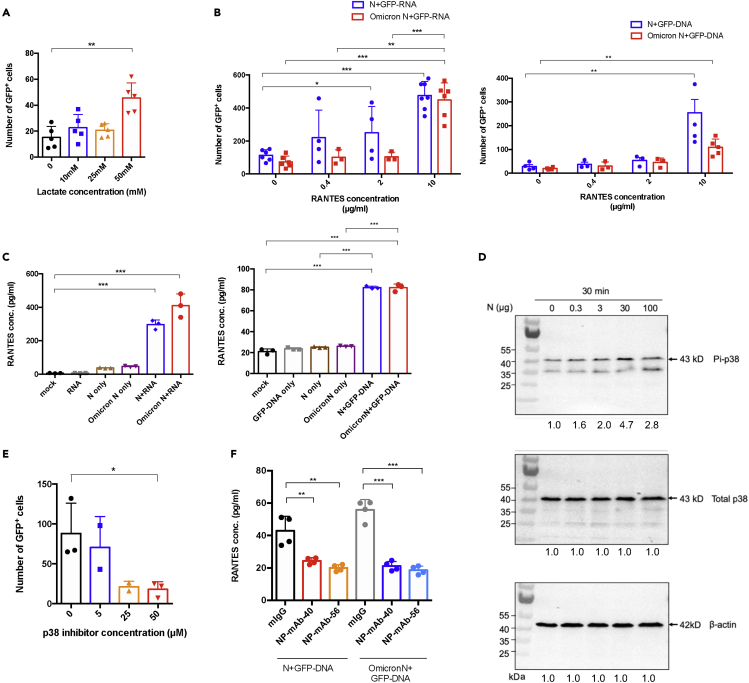
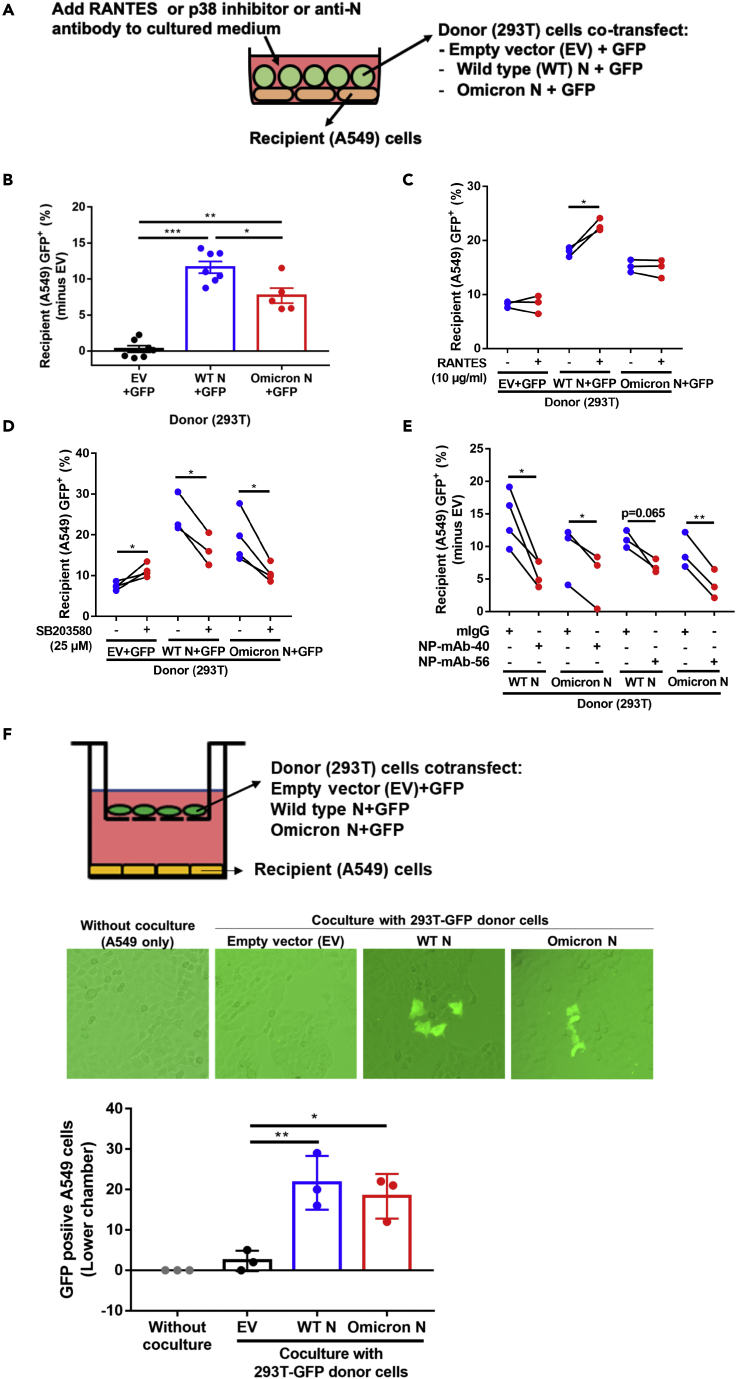
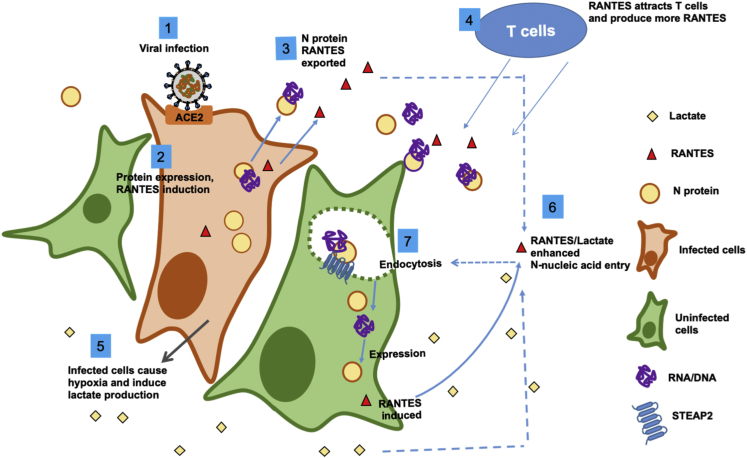
The coronavirus nucleocapsid (N) protein is known to bind to nucleic acids and facilitate viral genome encapsulation. Here we report that the N protein can mediate RNA or DNA entering neighboring cells through ACE2-independent, receptor (STEAP2)-mediated endocytosis, and achieve gene expression. The effect is more pronounced for the N protein of wild-type SARS-CoV-2 than that of the Omicron variant and other human coronaviruses. This effect is enhanced by RANTES (CCL5), a chemokine induced by N protein, and lactate, a metabolite produced in hypoxia, to cause more damage. These findings might explain the clinical observations in SARS-CoV-2-infected cases. Moreover, the N protein-mediated function can be inhibited by N protein-specific monoclonal antibodies or p38 mitogen-activated protein kinase inhibitors. Since the N-protein-mediated nucleic acid endocytosis involves a receptor commonly expressed in many types of cells, our findings suggest that N protein may have an additional role in SARS-CoV-2 pathogenesis.

Keywords: Molecular biology; Virology.


Conflict of interest statement

The authors declare no competing interests.

Figures

None
Graphical abstract
Figure 1
Figure 1
N protein binds to and enters the cell through STEAP2 (A) Comparison of the cell-binding capacity of SARS-CoV-2 wild type (WT) N protein and Omicron N protein expressed in either E. coli or mammalian cells. 1 × 105 A549 cells were used to mixed with 1 μg WT N or Omicron N proteins. One hour after protein addition, allophycocyanin (APC) conjugated anti-His antibody was used to detect the cell binding capacity of WT N protein or Omicron N protein. The samples were analyzed by flow cytometry and data are shown as mean fluorescence intensity (MFI). (B) Antibody blocking assay. Aliquots of 10 μg of SARS-CoV-2 N protein were pre-mixed with 0, 1, 3, 10, 30, and 100 μg of normal mouse IgG or anti-N monoclonal antibody (NP-mAb-40) and incubated at 4°C overnight. The antibody/N protein complex was used for the A549 cell surface binding assay. The blocking capacity of anti-N antibody was normalized to N protein only control. (C) Membrane fractions of A549 and HPAEpiC cells were extracted and incubated with N protein conjugated beads for 3 h binding at 4°C, and pull-downed for LC-MS-MS analysis (upper panels). A549 and HPAEpiC cells were suspended and treated with N protein for 1 h on ice. After incubation, cells were crosslinked with 3 mM DTSSP for 1.5 h. Then, cells were lysed in RIPA lysis buffer, and N protein complex in the lysate was immunoprecipitated for LC-MS-MS analysis (lower panels). Y axis denotes −logP values while the X axis shows log2 fold change values. Orange dots highlight the statistically significant proteins, with p value < 0.05 (-Log p > 1.3) and fold change>2, and the enriched plasma membrane protein was labeled on the plot. Identified proteins were further sorted by HuMemProtDB. (D) To knock-down (KD) STEAP2 expression, HPAEpiC cells were infected with lentivirus carrying STEAP2 shRNA followed by puromycin selection for 14 days. The STEAP2 mRNA expression levels were assessed by qRT-PCR, and the relative KD efficiency of shSTEAP2 was compared to shLacZ control (left-hand side panel). N protein binding capabilities to HPAEpiC STEAP2 KD cells and shLacZ control KD cells were assessed by flow cytometry analysis, and data were shown as mean fluorescence intensity (MFI). (right-hand side panel). (E) Western blot analysis of STEAP2 in wild type (WT) and knock-out (KO) A549 cells were shown. N protein binding to A549 STEAP2 KO cells was assessed by flow cytometry analysis and shown as mean fluorescence intensity (MFI). Ccr (crotonyl-CoAcarboxylase/reductase, a bacterial protein) binding was used as a control. (F) SARS-CoV-2 N protein enters alveolar cells. HPAEpiC cells were treated with 10 μg SARS-CoV-2 N protein overnight and then stained with anti-N antibody. The localization of N protein (Red) was checked by fluorescence microscope and cell morphology was observed by dimensional interference contrast (DIC). Nuclei of cells were stained by DAPI (blue). (G) N protein entering cells by endocytosis and N protein co-localization with STEAP2. HPAEpiC alveolar cells were seeded on 8 well slides. Cells were pretreated with endocytosis inhibitors HCQ, or Dynasore. Then the cells were treated with N protein overnight. After treatment, the cells were stained by specific antibodies to detected N protein (red), endosome marker (EEA1) (green), and STEAP2 (yellow). Cells were observed under fluorescent microscopy (Invitrogen tech.). Scale bar: 50 μm. All data are shown as mean ± SEM. ∗p < 0.05; ∗∗p < 0.01; ∗∗∗∗p < 0.0001; t test. See also Figure S5.
Figure 2
Figure 2
N protein delivers nucleic acids into cells (A) N protein-RNA complex binding to the cell surface. Aliquots of 10 μg SARS-CoV-2 N protein were incubated with 1 μg of indicated RNAs for 1 h at 4°C, and added to A549 or HPAEpiC cultures. SARS-CoV-2 N protein only without RNA was used as a control. The samples were analyzed by flow cytometry and data are shown as mean fluorescence intensity (MFI). Data are shown as mean ± SEM. ∗p < 0.05; ∗∗p < 0.01; ∗∗∗p < 0.001; t test. (B) The observation of N protein-RNA enters into cells. HPAEpiC were seeded onto 8-well glass slides (40,000 cells/well). SARS-CoV-2 N protein 10 μg and 40 μg RNA-FAM (green) were mixed for 1 h at 4°C. cells were treated with SARS-CoV-2 N-RNA-FAM mixture for 1 h. The groups of non-treated cells and RNA-FAM only were as controls. After treatment, N protein was detected by anti-N antibody (Red). The localization of RNA-FAM was green. DAPI (blue) indicates cell nuclei. Scale bar: 15 μm. (C) Lattice light sheet microscopy time lapse imaging of N protein-RNA complex entering into HPAEpiC cells. SARS-CoV-2 N protein 10 μg was mixed with 40 μg RNA-FAM (fluorescein) for 1 h at 4°C and then treated with ice-cooled alveolar cells. The signals of RNA-FAM and Hochest 33,342 were monitored by lattice light sheet microscopy at different time points.
Figure 3
Figure 3
Actions from N protein delivered nucleic acids (A) 293T cells were seeded in 48-well plate for overnight attachment. Aliquots of 10 μg SARS-CoV-2 N protein were incubated with 100 μL of indicated siRNA (10 μM) or 1 h at 4°C. N protein-siRNA complex was directly added into well and expression of the siRNA targeted genes was assessed by qRT-PCR after 48 h of treatment. (B) 293T cells were seeded onto 8-well glass slides (55,000 cells/well). SARS-CoV-2 N protein was pre-mixed with GFP-DNA (pmax-GFP) for 1 h at 4°C at indicated ratios. The N protein-GFP DNA mixtures were added to 293T cells. After 48 h, the GFP expression was observed by fluorescence microscopy. The groups of non-treated cells (MOCK) and GFP-DNA only (GFP-DNA 80 μg) were as controls. (C) Effect of N protein:GFP-DNA ratio. N protein and GFP-DNA were mixed by indicated conditions and incubated for 1h at 4°C. These WT N protein/GFP-DNA mixtures were added into 293T cells overnight (24 h) and the formation of mixtures and the number of GFP+ cells were counted by fluoresce microscopy. The best mass ratio of N protein to DNA for GFP expression was around 1:4. All data are shown as mean ± SEM. ∗p < 0.05; ∗∗p < 0.01; ∗∗∗p < 0.001; t test.
Figure 4
Figure 4
Lactate and RANTES enhance N protein-carried nucleic acid expression (A) Lactate effect. 293T cells were pretreated with lactate at indicated concentrations. After treatment, N-GFP DNA mixtures were added to 293T cells. The GFP+ cells were counted after 24 h. (B) Dose-dependent effect of RANTES. 293T cells were treated with an indicated dose of RANTES overnight. After treatment, Pre-mixed 10 μg mammalian cells-expressed WT N or Omicron N and 40 μg GFP-RNA (Left panel), GFP-DNA (Right panel) was added to cells overnight, and the number of GFP+ cells were counted under fluorescent microscopy. (C) N-RNA and N-DNA complexes induced RANTES. HPAEpiC cells were stimulated by mammalian expressed N protein, GFP-RNA (or DNA), and N+GFP-RNA (or DNA) mixture for 24 h. After treatment, protein secretion of RANTES was detected by flow cytometry analysis. (D) N protein was added to HPAEpic cells at indicated dosages for 30 min. After treatment, the cells were harvested and phosphorylation of p38 was detected by Western blotting. Quantification of band intensities was normalized by non-treated cells. (E) 293T cells were pretreated by p38 inhibitor (SB203580) at indicated dosages overnight. After treatment, the N-GFP-DNA mixtures were added to 293T cells. GFP+ cells number were counted after 24 h. (F) Mammalian cells-expressed N protein 4 μg pretreat with anti-N monoclonal antibody (NP-mAb-40 or 56) 10 μg/mL, and then mix with 12 μg GFP-DNA for 1 h, then the N+DNA/antibody complex are added to HPAEPic cells for 48 h. RANTES concentration in the supernatant is measured and detected by anti-RANTES beads by flow cytometry analysis. All data are shown as mean ± SEM. ∗p < 0.05; ∗∗p < 0.01; ∗∗∗p < 0.001; t test. See also Figures S6–S9.
Figure 5
Figure 5
N protein-assisted nucleic acid dispersion and expression in the co-culture environment (A)The co-culture system consisted of A549 as recipient cells, and 293T pre-transfected with two plasmids, one expressing GFP and the other expressing SARS-CoV-2 N protein or the pcDNA3.1 empty vector. (B–E) After 24 h co-culture of the donor cells and recipient cells, cell pool was stained with cytokeratin 18 (an A549 marker) and SV40 large T antigen (a 293T marker). A549 cells in the cell pool were gated from cytokeratin 18 positive and large T antigen negative. A549 GFP positive percentage was further assessed by flow cytometry analysis. Effects of SARS-CoV-2 N variants (B), treatment with RANTES (C), the p38 inhibitor SB203580 (D), or anti-N neutralizing antibody (E) were accessed by adding these effectors to the medium. Experiments are performed in three to five biological replicates. ∗, p value <0.05 (paired two-tailed student’s t-test). (F) SARS-CoV-2 N protein promotes gene delivery by cell-free diffusion to neighboring cells. A549 cells were plated in the lower chamber, while 293T donor cells co-transfected with plasmids expressing EGFP and indicated N proteins in the upper chamber. After 3 days of co-culture, GFP positive A549 cells were observed and counted. See also Figures S10 and S11.
Figure 6
Figure 6
Working hypothesis A working hypothesis for SARS-CoV-2 N protein is proposed: Expression of SARS-CoV-2 N protein promotes p38 MAPK activation and RANTES chemokine secretion (1,2). N protein/nucleic acid complexes are secreted (3). The chemokines induced by N protein attract T cells, which produce more RANTES (4). The infected cells may cause local hypoxia and produce lactate (5). RANTES and lactate enhance N-protein-nucleic acid endocytosis by neighboring cells (6,7), and cause more tissue damage. The RNA/DNA carried by N protein could be originated from the virus or the host cell.

Similar articles

Cited by

References

    1. Chan J.F.W., Kok K.H., Zhu Z., Chu H., To K.K.W., Yuan S., Yuen K.Y. Genomic characterization of the 2019 novel human-pathogenic coronavirus isolated from a patient with atypical pneumonia after visiting Wuhan. Emerg. Microbes Infect. 2020;9:221–236. doi: 10.1080/22221751.2020.1719902. - DOI - PMC - PubMed
    1. Gordon D.E., Jang G.M., Bouhaddou M., Xu J., Obernier K., White K.M., O'Meara M.J., Rezelj V.V., Guo J.Z., Swaney D.L., et al. A SARS-CoV-2 protein interaction map reveals targets for drug repurposing. Nature. 2020;583:459–468. doi: 10.1038/s41586-020-2286-9. - DOI - PMC - PubMed
    1. Wu F., Zhao S., Yu B., Chen Y.M., Wang W., Song Z.G., Hu Y., Tao Z.W., Tian J.H., Pei Y.Y., et al. A new coronavirus associated with human respiratory disease in China. Nature. 2020;579:265–269. doi: 10.1038/s41586-020-2008-3. - DOI - PMC - PubMed
    1. Masters P.S. Coronavirus genomic RNA packaging. Virology. 2019;537:198–207. doi: 10.1016/j.virol.2019.08.031. - DOI - PMC - PubMed
    1. Long Q.X., Liu B.Z., Deng H.J., Wu G.C., Deng K., Chen Y.K., Liao P., Qiu J.F., Lin Y., Cai X.F., et al. Antibody responses to SARS-CoV-2 in patients with COVID-19. Nat. Med. 2020;26:845–848. doi: 10.1038/s41591-020-0897-1. - DOI - PubMed

LinkOut - more resources