. 2023 Feb 17;26(2):105972.
doi: 10.1016/j.isci.2023.105972. Epub 2023 Jan 13.

SARS-CoV-2 variants induce distinct disease and impact in the bone marrow and thymus of mice

Affiliations

SARS-CoV-2 variants induce distinct disease and impact in the bone marrow and thymus of mice

Rute Gonçalves et al. iScience. .

Abstract

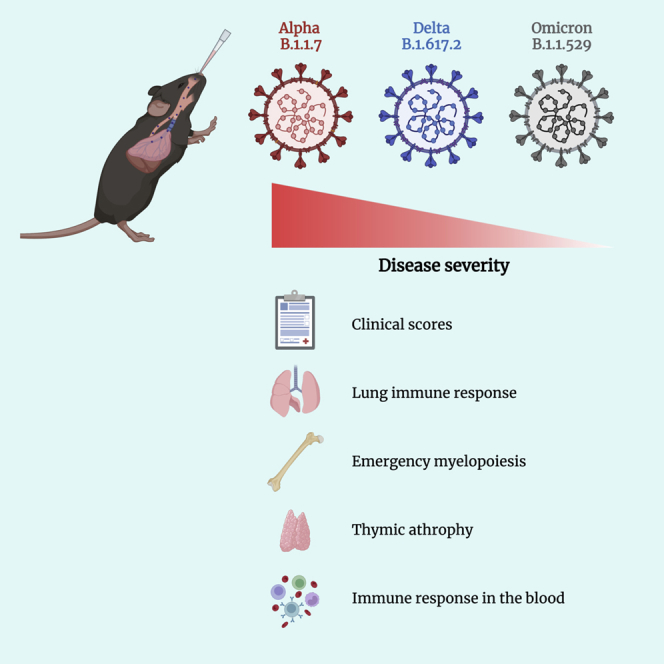
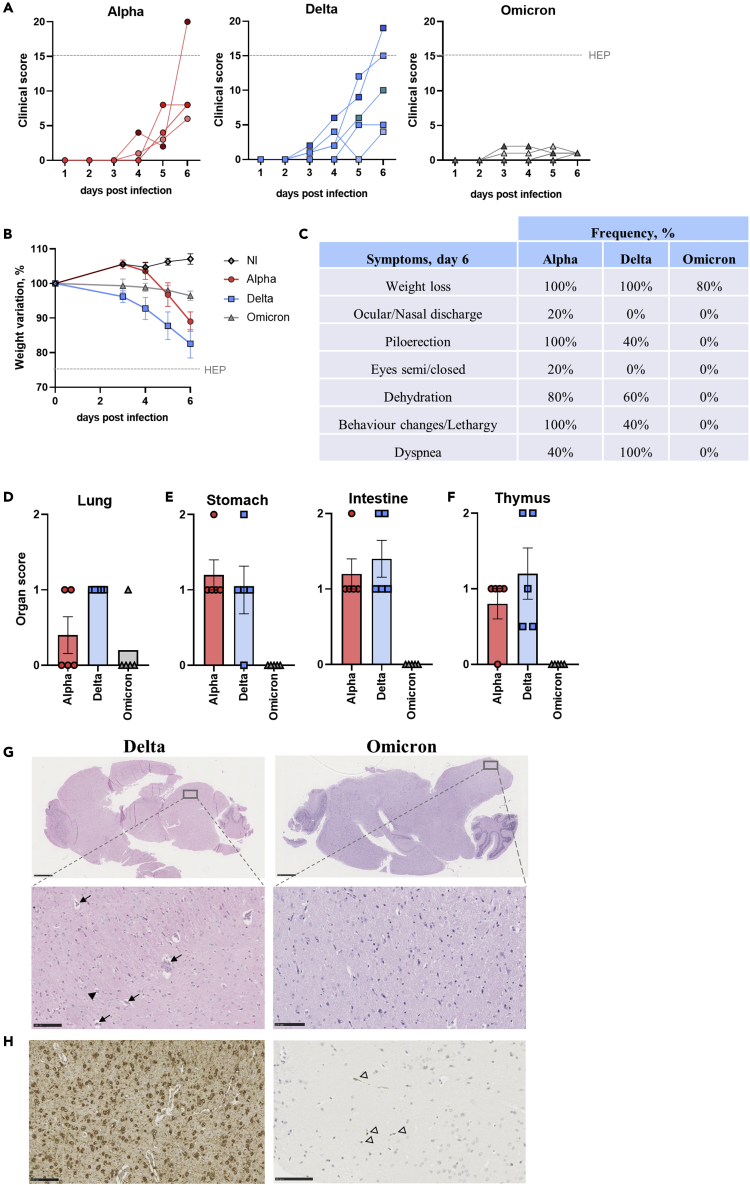
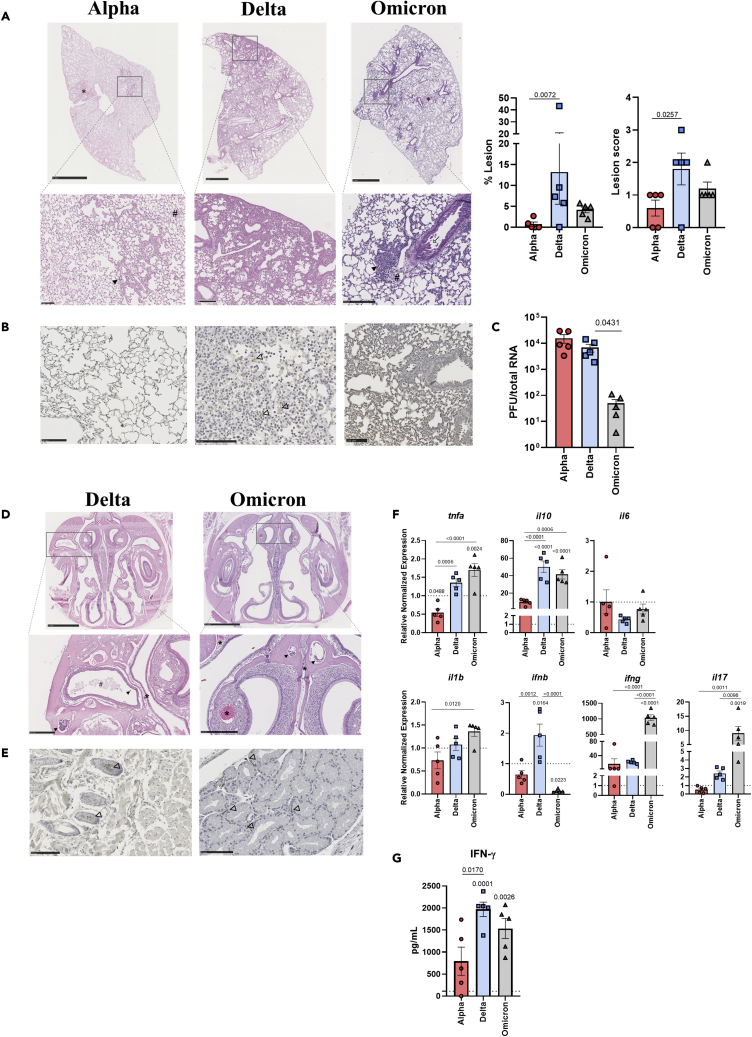
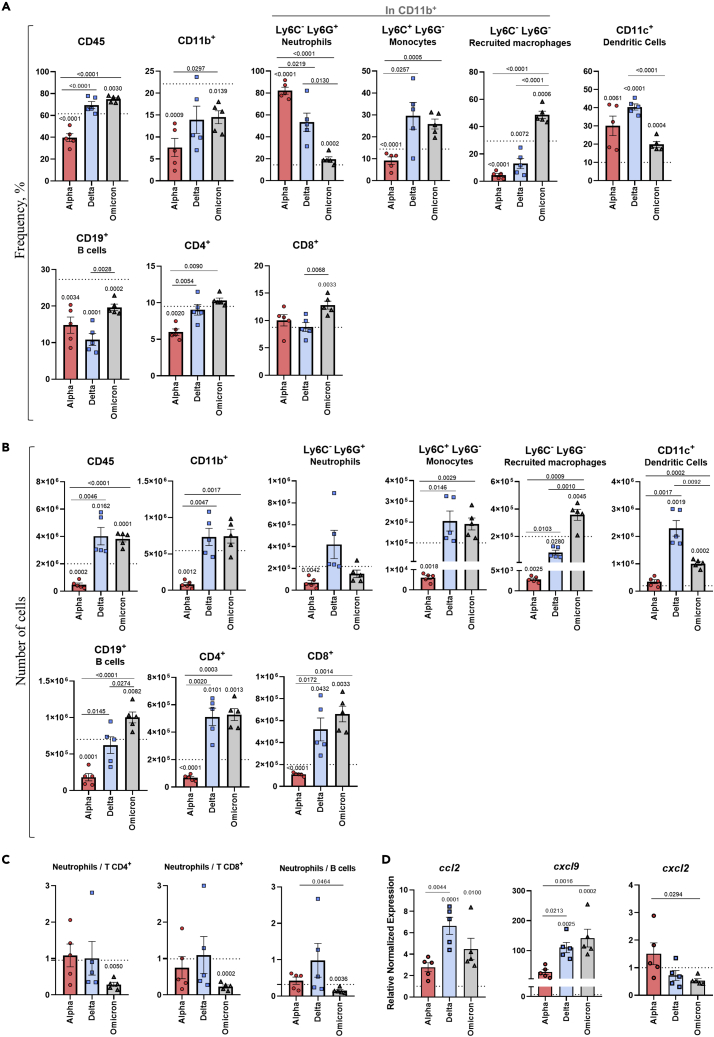
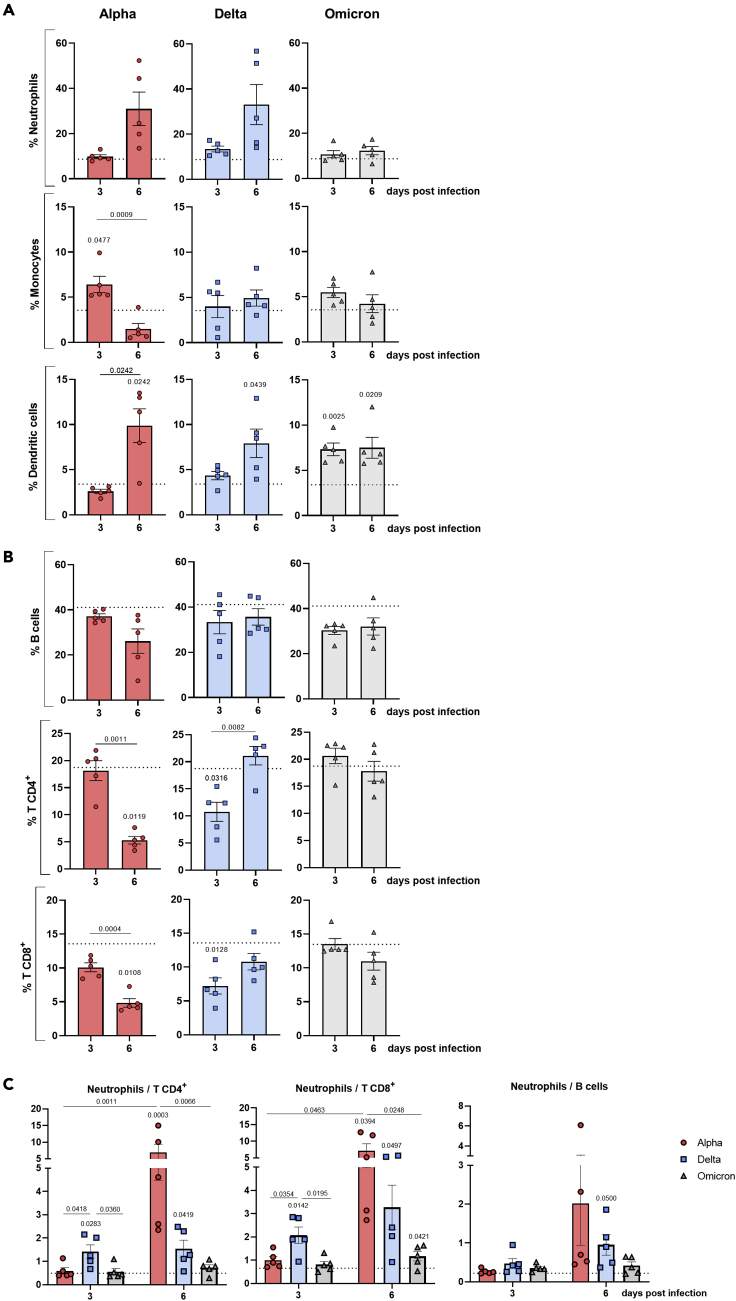
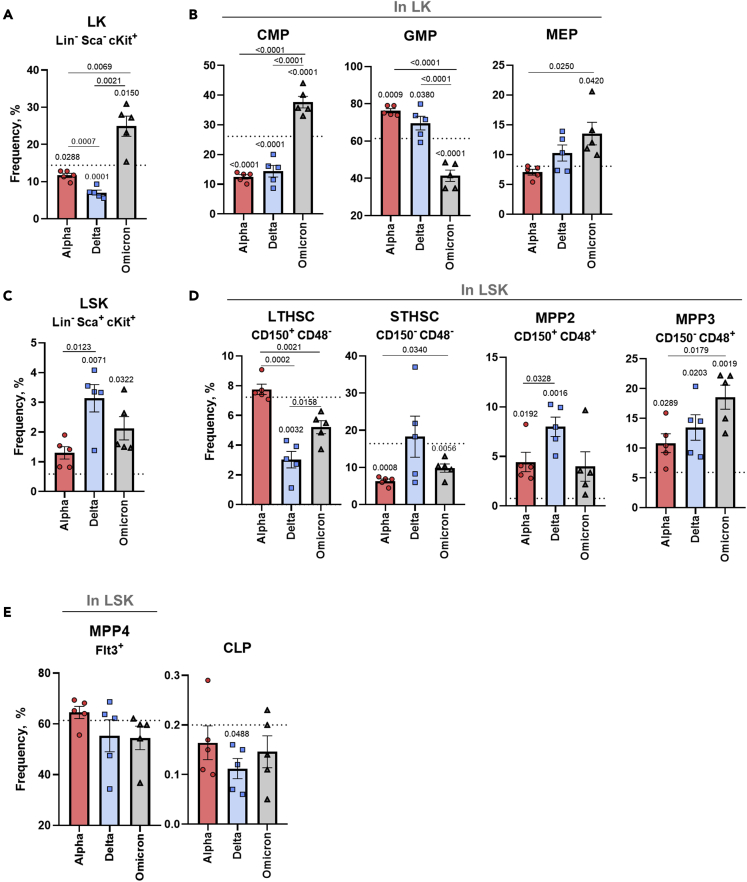
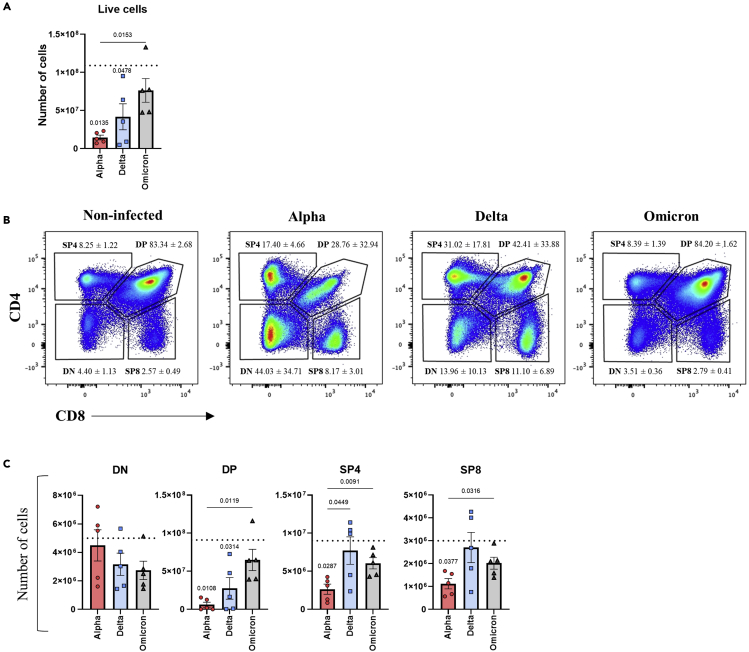
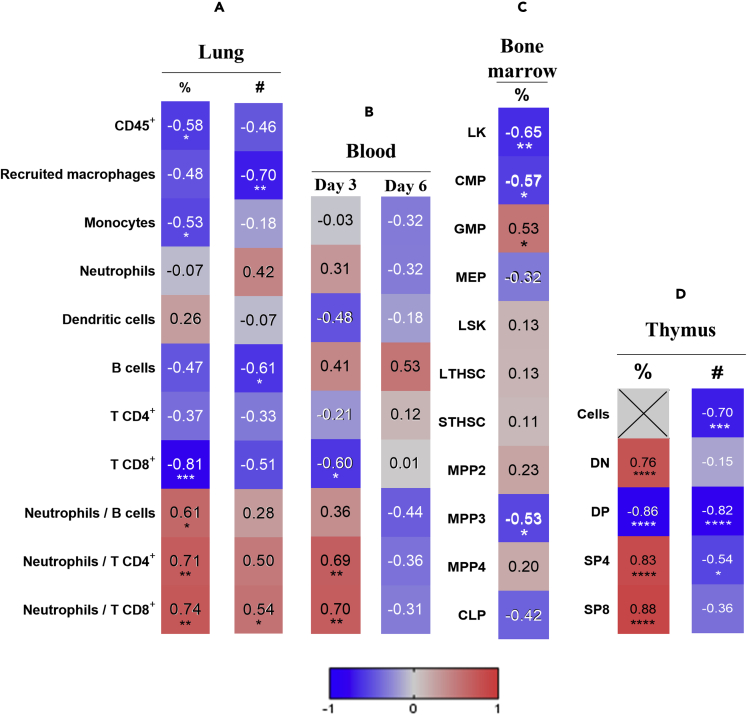
Severe acute respiratory syndrome coronavirus 2 (SARS-CoV-2) has evolved to variants associated with milder disease. We employed the k18-hACE2 mouse model to study how differences in the course of infection by SARS-CoV-2 variants alpha, delta, and omicron relate to tissue pathology and the immune response triggered. We documented a variant-specific pattern of infection severity, inducing discrete lung and blood immune responses and differentially impacting primary lymphoid organs. Infections with variants alpha and delta promoted bone marrow (BM) emergency myelopoiesis, with blood and lung neutrophilia. The defects in the BM hematopoietic compartment extended to the thymus, with the infection by the alpha variant provoking a marked thymic atrophy. Importantly, the changes in the immune responses correlated with the severity of infection. Our study provides a comprehensive platform to investigate the modulation of disease by SARS-CoV-2 variants and underscores the impact of this infection on the function of primary lymphoid organs.

Keywords: Components of the immune system; Immunology; Pathology; Virology.


Conflict of interest statement

The authors declare no competing interests.

Figures

None
Graphical abstract
Figure 1
Figure 1
Infection of k18-hACE2 mice with SARS-CoV-2 alpha, delta or omicron variants results in differential disease outcomes k18-hACE2 mice were intranasally infected with 1 × 104 PFU of the indicated SARS-CoV-2 variant. (A) Clinical score evolution. Each mouse was observed on day 0 and daily from day 3 post-infection and a clinical score attributed. Clinical scores of 15 or above were considered humane endpoints (HEP; dotted lines). (B) Percentage of weight variation over time. Initial weight on day 0 is considered 100% and from day 3 post-infection the variation calculated for each mouse. (C) On day 6 post-infection the frequency of mice displaying each indicated symptom across the three infections was registered. (D–F) During necropsy, a macroscopic inspection of several organs was performed and an organ score reflecting visible alterations attributed. (G) Representative images of brain tissue slices stained with H&E. Rectangles and dashed lines indicate the region enlarged below. Inflammatory cells (arrowhead) and cellular debris (arrow) are indicated. Scale bars represent 1 mm (upper panels) and 100 μm (lower panels). (H) Brain tissue slices were stained with a specific antibody against the viral nucleocapsid. Stained areas (brown, open arrowhead) indicate the presence of viral particles in the tissue. Scale bars represent 100 μm. A, D-F. Each symbol represents an individual mouse of a group of five used in each infection. B, D-F. Represented is the Mean ± SEM for each group.
Figure 2
Figure 2
Impact of SARS-CoV-2 alpha, delta, and omicron variants on the respiratory tract of infected k18-hACE2 mice k18-hACE2 mice were intranasally infected with 1 × 104 PFU of the indicated SARS-CoV-2 variant. On day 6 post-infection mice were humanely euthanized and the lungs and nasal turbinates recovered. (A and B) Representative images of tissue slices of lungs of infected mice stained with H&E (A) or a specific antibody against the viral nucleocapsid (B). In A, a histopathology score was attributed to H&E stained lungs and the area of lesion automatically calculated. (C) Virus quantification at day 6 post-infection. Based on the detection of viral RNA and on quantified standard curves, the number of viral particles (PFU) in the lungs of infected mice was calculated. D, E. Representative images of tissue slices of nasal turbinates of infected mice stained with H&E (D) or a specific antibody against the viral nucleocapsid (E). (A and D) Rectangles and dashed lines indicate the regions enlarged in lower panels. Thickened epithelium (open arrow); inflammatory cell infiltrates (arrowhead); hemorrhage (∗) and cellular debris/exudate (#) are indicated. (B and E) Stained areas (open arrowhead) indicate the presence of viral particles in the tissue. Scale bars represent 1 mm (top panels) and 250 μm (bottom panels), except for the lung image of mice infected with the alpha VOC which is 100 μm. (F) Relative expression of cytokine genes in the lung of infected animals. mRNA was extracted, the expression of the indicated genes measured by real-time PCR and normalized using gapdh and ubiquitin reference genes. The expression of non-infected mice is set to 1 (dotted line). (G) IFN-γ levels detected by immunoassay on day 6 post-infection in the bronchoalveolar lavage of infected mice. A, C, F, G. Represented is the Mean ± SEM for each experimental group and individual mice shown as discrete symbols. Statistical analyses were conducted using the Kruskal-Wallis test (A), Brown-Forsythe and Welch ANOVA test (C), and one-way ANOVA (F, G). Differences between groups were considered significant if p < 0.05. p values shown above bars refer to differences to non-infected mice.
Figure 3
Figure 3
Distinct immune cell recruitment to the lungs of k18-hACE2 mice infected with SARS-CoV-2 alpha, delta or omicron variants Lung cell suspensions were prepared from k18-hACE2 mice on day 6 post-infection and the indicated immune cell populations detected by multiparametric flow cytometry. Gating strategies are in Figure S3. Naive k18-hACE2 mice were used as controls. (A and B) Frequency and B. numbers of the analyzed immune cell populations. (C) Ratios of neutrophils to CD4+ T, CD8+ T cells, or CD19+ B cells calculated from cell numbers in the total lung. (D) Relative expression of ccl2, cxcl9 and cxcl2 genes in the lung of infected animals, day 6 post-infection. mRNA was extracted, the expression of the indicated genes measured by real-time PCR and normalized using gapdh and ubiquitin reference genes. Represented is the Mean ± SEM for each experimental group and individual mice shown as discrete symbols. The dotted lines in each graph refer to the mean on non-infected mice, and the individual values are represented in Figure S3. Statistical analyses were conducted using the one-way ANOVA e Brown-Forsythe and Welch ANOVA test (A-C) and one-way ANOVA(D). Differences between groups were considered significant if p < 0.05. p values shown above bars refer to differences to non-infected mice.
Figure 4
Figure 4
Longitudinal analysis of blood immune cell populations of k18-hACE2 mice infected with SARS-CoV-2 alpha, delta or omicron variants Blood samples of k18-hACE2 mice were collected on days 3 and 6 post-infection and the indicated immune cell populations detected by multiparametric flow cytometry. Gating strategies are in Figure S3. Naive k18-hACE2 mice were used as controls. (A and B) Myeloid and B. lymphoid cell frequencies at the indicated time points post-infection with alpha, delta or omicron variants. (C) Ratios of neutrophils to CD4+ T, CD8+ T or CD19+ B cells calculated from data in A and B. Represented is the Mean ± SEM for each experimental group and individual mice shown as discrete symbols. The dotted lines in each graph refer to the mean on non-infected mice, and the individual values are represented in Figure S3. Unpaired one-way or Brown-Forsythe and Welch ANOVA tests were used to perform comparisons between groups. Differences between groups were considered significant if p < 0.05. p values shown above bars refer to differences to non-infected mice.
Figure 5
Figure 5
Evidence of emergency myelopoiesis induced by SARS-CoV-2 infection (A)BM cell suspensions obtained from k18-hACE2 mice on day 6 post-infection were lineage-depleted and stained for hematopoietic progenitor subsets. Gating strategies are in Figure S4. Naive k18-hACE2 mice were used as controls. Frequencies of BM A. LK (LinIL-7Rα-cKit+Sca-1-). (B) CMP (LinIL-7Rα-c-Kit+Sca-1FcγRloCD34+), GMP (LinIL-7Rα-c-Kit+Sca-1FcγR+CD34hi) and MEP (LinIL-7Rα-c-Kit+Sca-1FcγR-CD34lo). (C) LSK (LinIL-7Rα-cKit+Sca-1+). (D and E) LT-HSC (LinIL-7Rα-c-Kit+Sca-1+CD150+CD48), ST-HSC (LinIL-7Rα-c-Kit+Sca-1+CD150CD48), MPP2 (LinIL-7Rα-c-Kit+Sca-1+CD150+CD48+) and MPP3 (LinIL-7Rα-c-Kit+Sca-1+CD150CD48+) and E. MPP4 (LinIL-7Rα-c-Kit+Sca-1+Flt3+) and CLP (LinIL-7Rα+c-Kit+Sca-1+) populations. Represented is the Mean ± SEM for each experimental group and individual mice shown as discrete symbols. The dotted lines in each graph refer to the mean on non-infected mice, and the individual values are represented in Figure S4. Unpaired one-way or Brown-Forsythe and Welch ANOVA tests were used to perform comparisons between groups. Differences between groups were considered significant if p < 0.05. p values shown above bars refer to differences to non-infected mice.
Figure 6
Figure 6
Distinct thymic T cell development during SARS-CoV-2 infections Thymic cell suspensions obtained from k18-hACE2 mice on day 6 post-infection were stained for thymocyte subsets. Gating strategies are in Figure S4. Naive k18-hACE2 mice were used as controls. (A) Live cell numbers. (B and C) Frequency plots and C. numbers of the analyzed thymocyte populations. The maturation stages represented are: double-negative (DN; TCRCD4CD8), double-positive (DP; TCR+CD4+CD8+), single positive 4 (SP4; TCR+CD4+CD8), and single positive 8 (SP8; TCR+CD4CD8+). Represented is the Mean ± SEM for each experimental group and individual mice shown as discrete symbols. The dotted lines in each graph refer to the mean on non-infected mice, and the individual values are represented in Figure S4. Unpaired Brown-Forsythe and Welch ANOVA tests were used to perform comparisons between groups. Differences between groups were considered significant if p < 0.05. p values shown above bars refer to differences to non-infected mice.
Figure 7
Figure 7
Altered immune responses in the lung, blood and primary lymphoid organs correlate with disease severity (A–D)Pearson correlations calculated for frequency and number of immune cell populations or ratios obtained in the A. lung, B. blood, C. BM and D. thymus with the clinical score obtained on days 3 or 6 post-infection, for all animals in the three infections. A two-tailed Pearson test was conducted to correlate the clinical score and each cell population. Correlations were defined as weak if r = 0 to 0.3; moderate if r = 0.3 to 0.5; strong if r = 0.5 to 0.7; and very strong if r = 0.7 to 1. Differences between groups were considered significant if p < 0.05. ∗p<0.05; ∗∗p<0.01; ∗∗∗p<0.001; ∗∗∗∗p<0.0001.

Similar articles

Cited by

References

    1. de Souza A.S., de Freitas Amorim V.M., Guardia G.D.A., Dos Santos F.F., Ulrich H., Galante P.A.F., de Souza R.F., Guzzo C.R. Severe acute respiratory syndrome coronavirus 2 variants of concern: a perspective for emerging more transmissible and vaccine-resistant strains. Viruses. 2022;14 doi: 10.3390/v14040827. - DOI - PMC - PubMed
    1. Flores-Vega V.R., Monroy-Molina J.V., Jimenez-Hernandez L.E., Torres A.G., Santos-Preciado J.I., Rosales-Reyes R. SARS-CoV-2: evolution and emergence of new viral variants. Viruses. 2022;14 doi: 10.3390/v14040653. - DOI - PMC - PubMed
    1. McLean G., Kamil J., Lee B., Moore P., Schulz T.F., Muik A., Sahin U., Türeci Ö., Pather S. The impact of evolving SARS-CoV-2 mutations and variants on COVID-19 vaccines. mBio. 2022;13 doi: 10.1128/mbio.02979-21. - DOI - PMC - PubMed
    1. Muñoz-Fontela C., Dowling W.E., Funnell S.G.P., Gsell P.S., Riveros-Balta A.X., Albrecht R.A., Andersen H., Baric R.S., Carroll M.W., Cavaleri M., et al. Animal models for COVID-19. Nature. 2020;586:509–515. doi: 10.1038/s41586-020-2787-6. - DOI - PMC - PubMed
    1. Hassan A.O., Case J.B., Winkler E.S., Thackray L.B., Kafai N.M., Bailey A.L., McCune B.T., Fox J.M., Chen R.E., Alsoussi W.B., et al. A SARS-CoV-2 infection model in mice demonstrates protection by neutralizing antibodies. Cell. 2020;182:744–753.e4. doi: 10.1016/j.cell.2020.06.011. - DOI - PMC - PubMed

LinkOut - more resources