

Machine learning sentiment analysis, COVID-19 news and stock market reactions
- PMID: 36687319
- PMCID: PMC9842392
- DOI: 10.1016/j.ribaf.2023.101881
Machine learning sentiment analysis, COVID-19 news and stock market reactions
Abstract
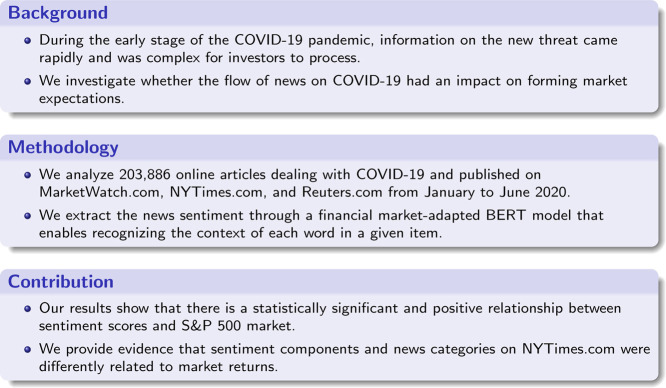
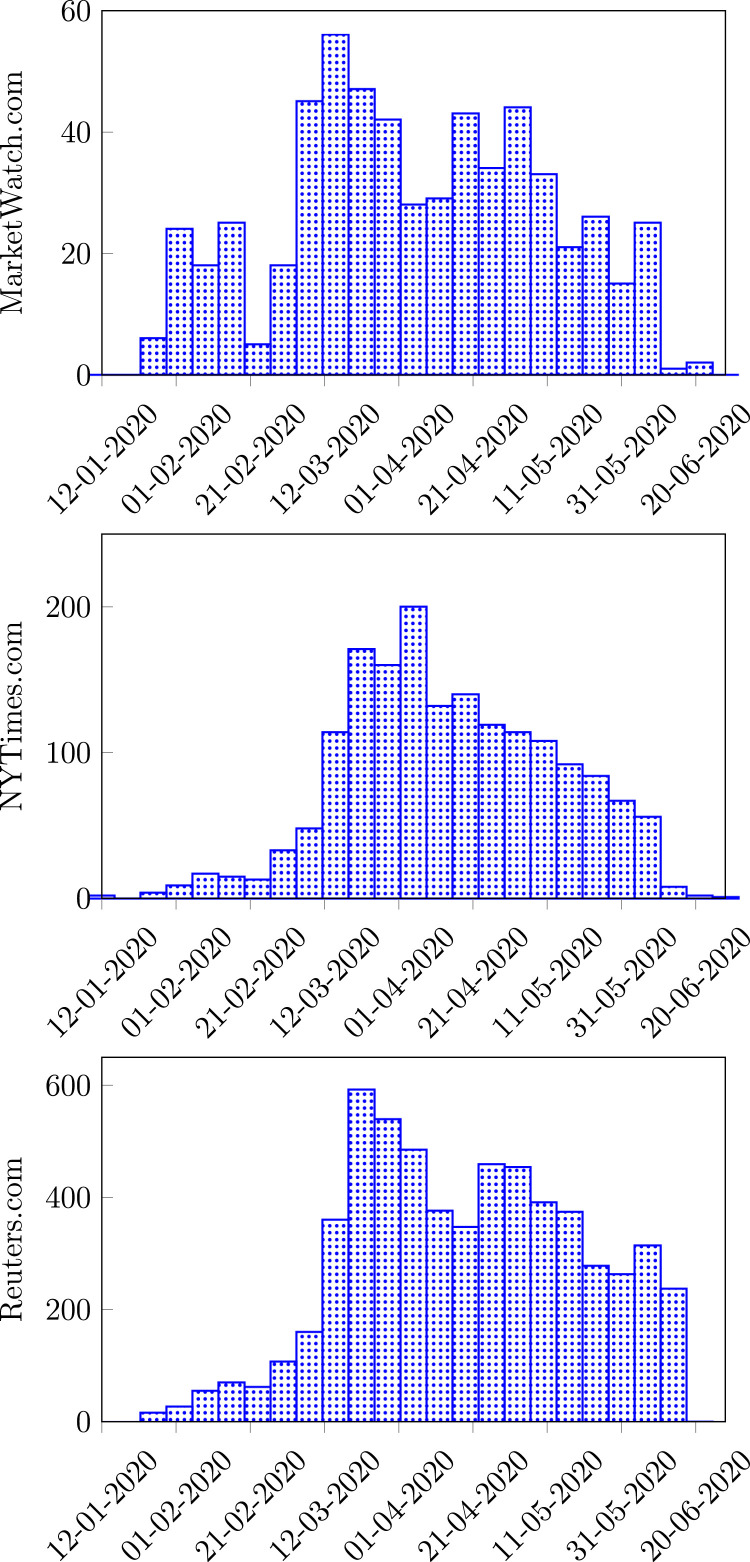
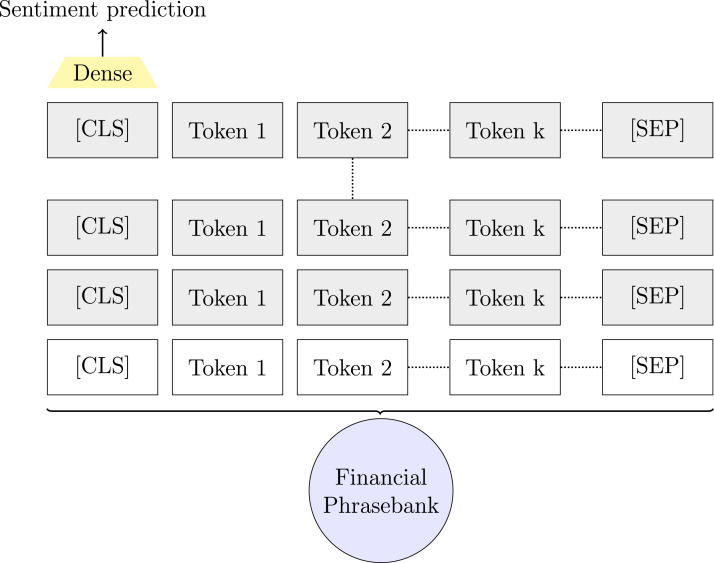
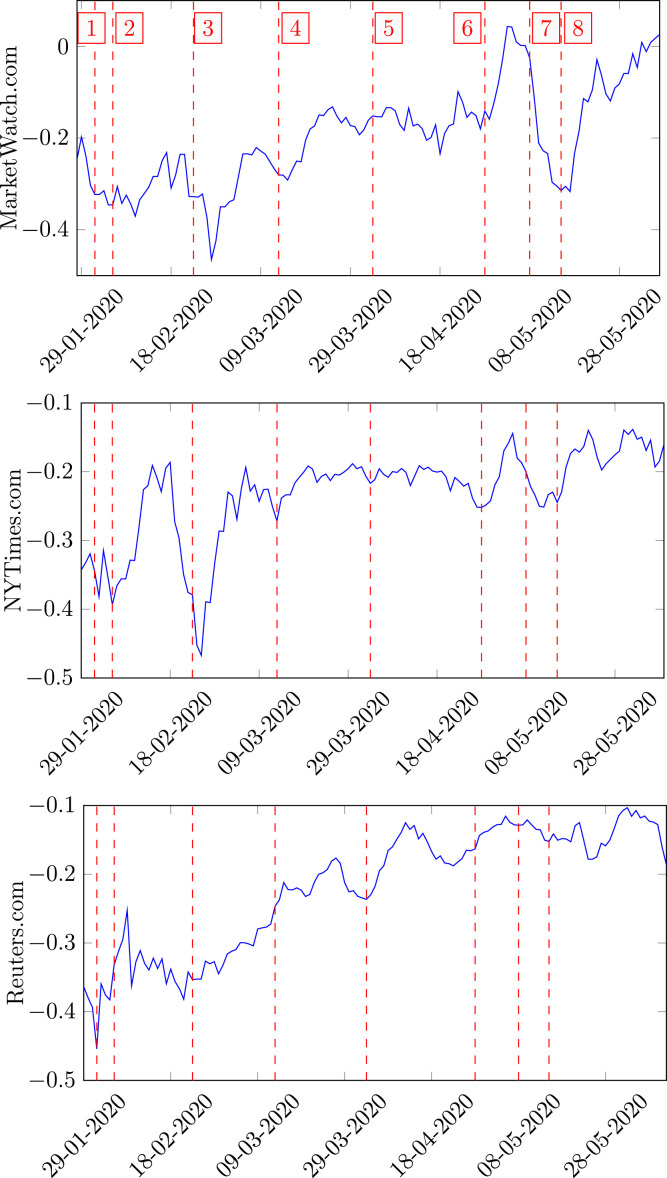
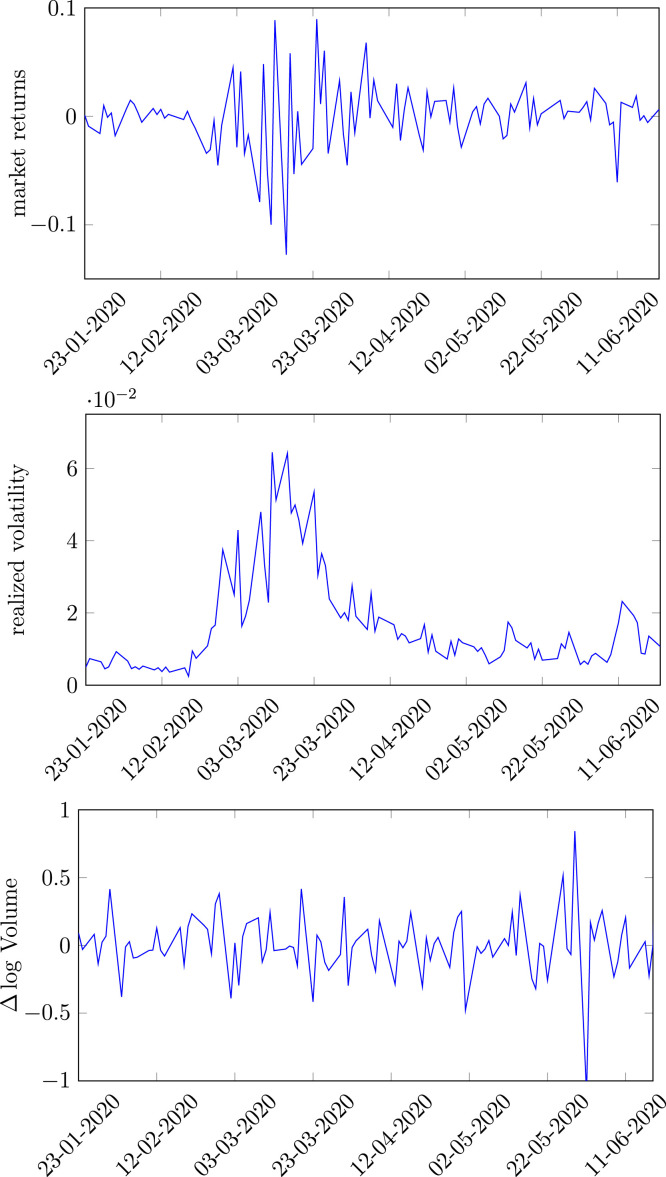
The recent COVID-19 pandemic represents an unprecedented worldwide event to study the influence of related news on the financial markets, especially during the early stage of the pandemic when information on the new threat came rapidly and was complex for investors to process. In this paper, we investigate whether the flow of news on COVID-19 had an impact on forming market expectations. We analyze 203,886 online articles dealing with COVID-19 and published on three news platforms (MarketWatch.com, NYTimes.com, and Reuters.com) in the period from January to June 2020. Using machine learning techniques, we extract the news sentiment through a financial market-adapted BERT model that enables recognizing the context of each word in a given item. Our results show that there is a statistically significant and positive relationship between sentiment scores and S&P 500 market. Furthermore, we provide evidence that sentiment components and news categories on NYTimes.com were differently related to market returns.
Keywords: COVID-19 news; Sentiment analysis; Stock markets.
© 2023 Elsevier B.V. All rights reserved.
Conflict of interest statement
The authors declare that they have no known competing financial interests or personal relationships that could have appeared to influence the work reported in this paper.
Figures

Similar articles
-
Financial market sentiment and stock return during the COVID-19 pandemic.Financ Res Lett. 2023 Jun;54:103709. doi: 10.1016/j.frl.2023.103709. Epub 2023 Feb 17. Financ Res Lett. 2023. PMID: 36811022 Free PMC article.
-
On the impact of publicly available news and information transfer to financial markets.R Soc Open Sci. 2021 Jul 28;8(7):202321. doi: 10.1098/rsos.202321. eCollection 2021 Jul. R Soc Open Sci. 2021. PMID: 34350010 Free PMC article.
-
An efficient hybrid stock trend prediction system during COVID-19 pandemic based on stacked-LSTM and news sentiment analysis.Multimed Tools Appl. 2022 Nov 28:1-33. doi: 10.1007/s11042-022-14216-w. Online ahead of print. Multimed Tools Appl. 2022. PMID: 36467438 Free PMC article.
-
Does Twitter Affect Stock Market Decisions? Financial Sentiment Analysis During Pandemics: A Comparative Study of the H1N1 and the COVID-19 Periods.Cognit Comput. 2022;14(1):372-387. doi: 10.1007/s12559-021-09819-8. Epub 2021 Jan 23. Cognit Comput. 2022. PMID: 33520006 Free PMC article.
-
How does the Vietnamese stock market react when the Fed gives an announcement in time at the zero lower bound?Heliyon. 2024 Nov 1;10(21):e40047. doi: 10.1016/j.heliyon.2024.e40047. eCollection 2024 Nov 15. Heliyon. 2024. PMID: 39553599 Free PMC article. Review.
Cited by
-
Machine learning and game theory for cyber governance: Enhancing public opinion and regional sustainable development.PLoS One. 2024 Dec 5;19(12):e0308317. doi: 10.1371/journal.pone.0308317. eCollection 2024. PLoS One. 2024. PMID: 39636835 Free PMC article.
-
Enhanced stock market forecasting using dandelion optimization-driven 3D-CNN-GRU classification.Sci Rep. 2024 Sep 8;14(1):20908. doi: 10.1038/s41598-024-71873-7. Sci Rep. 2024. PMID: 39245700 Free PMC article.
-
COVID-19's influence on Karachi stock exchange: A comparative machine learning algorithms study for forecasting.Heliyon. 2024 Jun 17;10(13):e33190. doi: 10.1016/j.heliyon.2024.e33190. eCollection 2024 Jul 15. Heliyon. 2024. PMID: 39035502 Free PMC article.
-
Computational linguistics based text emotion analysis using enhanced beetle antenna search with deep learning during COVID-19 pandemic.PeerJ Comput Sci. 2023 Dec 6;9:e1714. doi: 10.7717/peerj-cs.1714. eCollection 2023. PeerJ Comput Sci. 2023. PMID: 38192459 Free PMC article.
-
Network based evidence of the financial impact of Covid-19 pandemic.Int Rev Financ Anal. 2022 May;81:102101. doi: 10.1016/j.irfa.2022.102101. Epub 2022 Mar 21. Int Rev Financ Anal. 2022. PMID: 36536770 Free PMC article.
References
-
- Ahmad W., Kutan A.M., Gupta S. Black swan events and COVID-19 outbreak: Sector level evidence from the US, UK, and European stock markets. Int. Rev. Econ. Finance. 2021;75:546–557. doi: 10.1016/j.iref.2021.04.007. - DOI
-
- Ahmed S., Alshater M.M., El Ammari A., Hammami H. Artificial intelligence and machine learning in finance: A bibliometric review. Res. Int. Bus. Finance. 2022;61 doi: 10.1016/j.ribaf.2022.101646. - DOI
-
- Andriotis P., Takasu A., Tryfonas T. In: Advances in Digital Forensics. Peterson G., Shenoi S., editors. Springer; Cham: 2014. Smartphone message sentiment analysis; pp. 253–265. - DOI
Publication types
LinkOut - more resources
Full Text Sources