

A comparative study on the three calculation methods for reproduction numbers of COVID-19
- PMID: 36687425
- PMCID: PMC9849755
- DOI: 10.3389/fmed.2022.1079842
A comparative study on the three calculation methods for reproduction numbers of COVID-19
Abstract
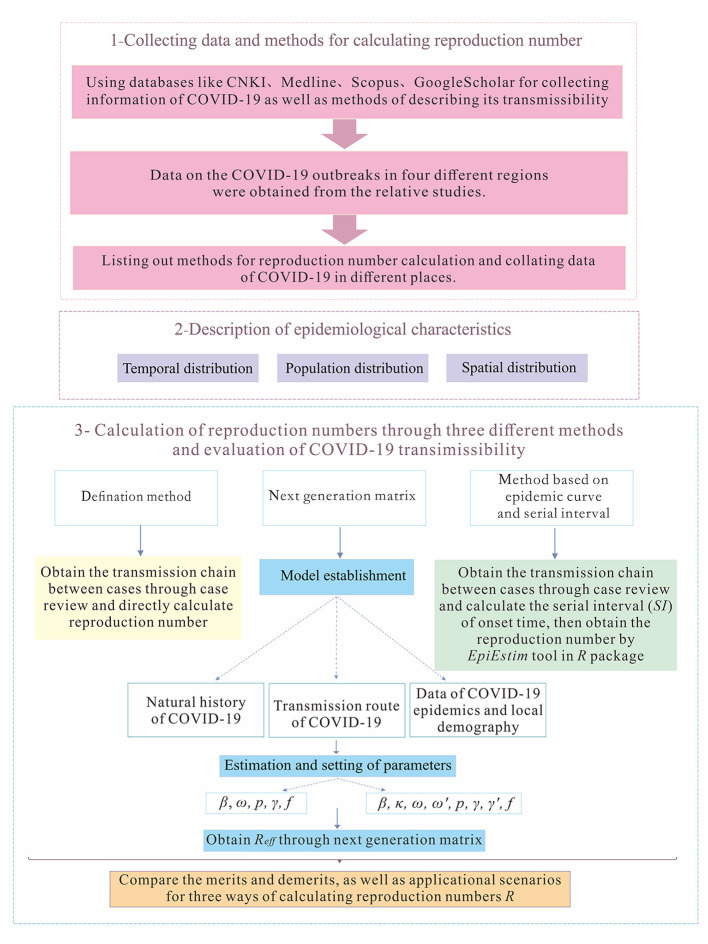
Objective: This study uses four COVID-19 outbreaks as examples to calculate and compare merits and demerits, as well as applicational scenarios, of three methods for calculating reproduction numbers.
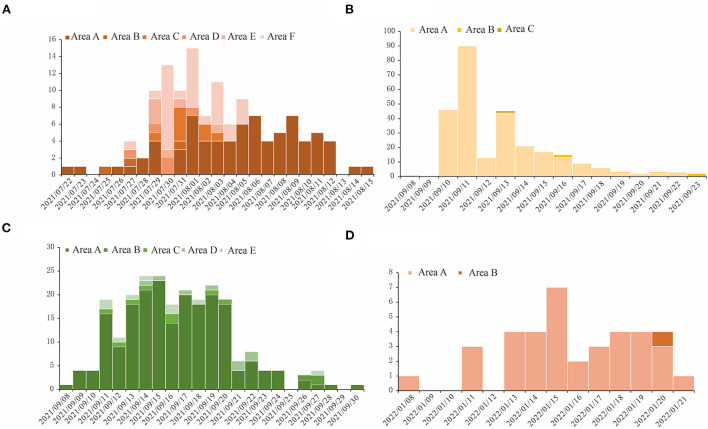
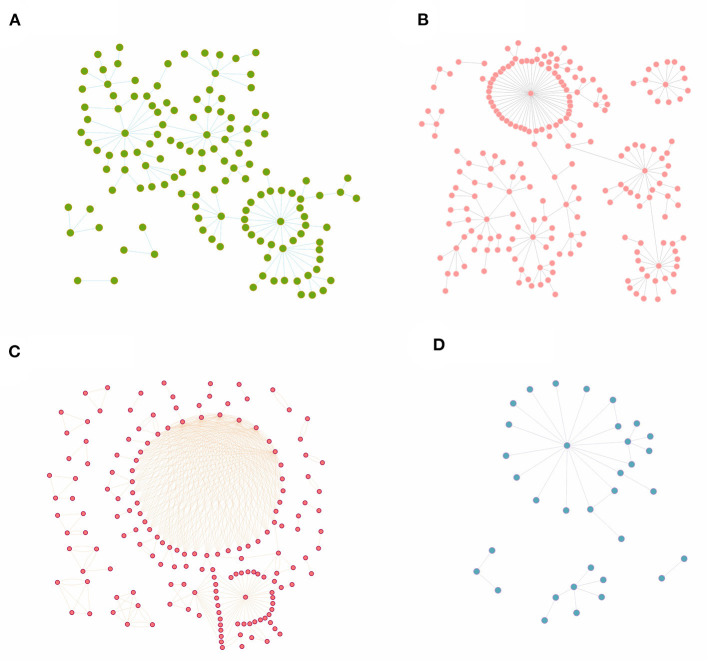
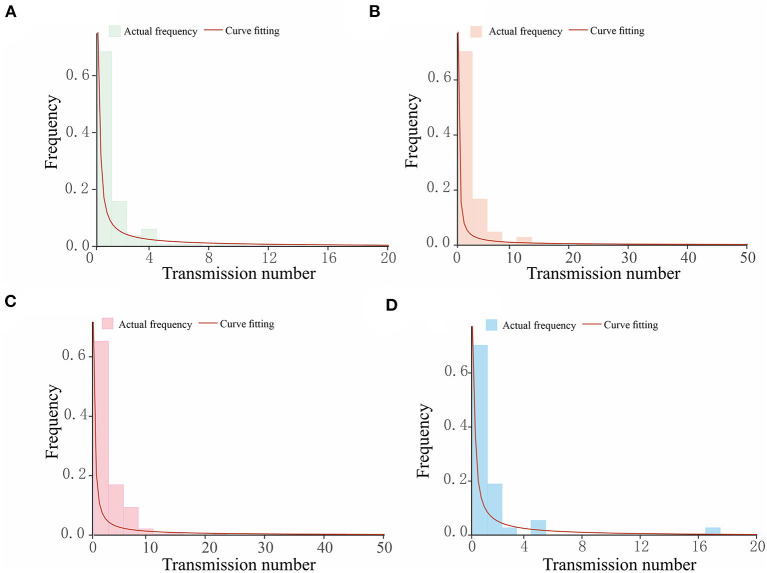
Method: The epidemiological characteristics of the COVID-19 outbreaks are described. Through the definition method, the next-generation matrix-based method, and the epidemic curve and serial interval (SI)-based method, corresponding reproduction numbers were obtained and compared.
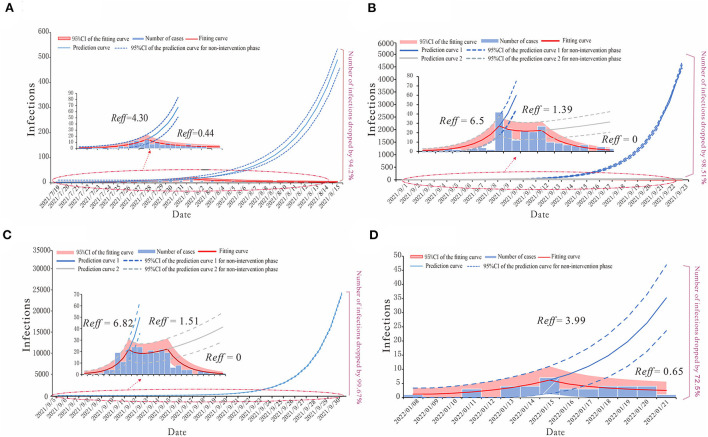
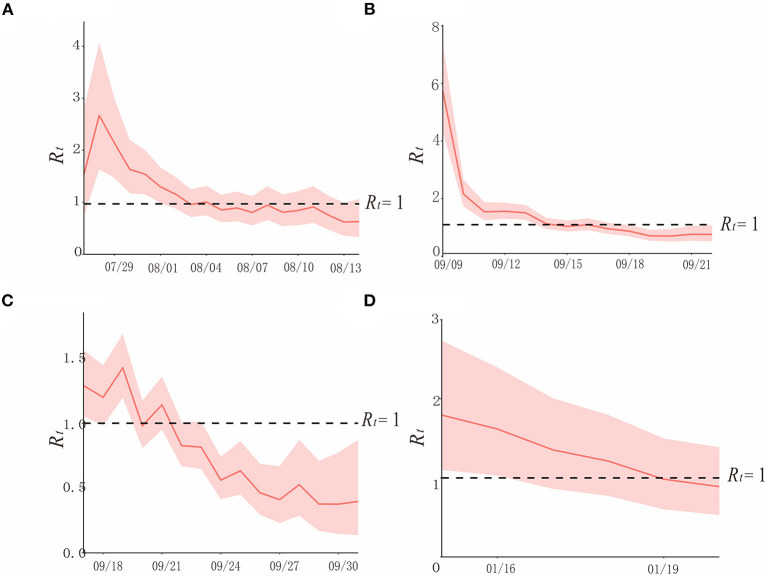
Results: Reproduction numbers (R eff ), obtained by the definition method of the four regions, are 1.20, 1.14, 1.66, and 1.12. Through the next generation matrix method, in region H R eff = 4.30, 0.44; region P R eff = 6.5, 1.39, 0; region X R eff = 6.82, 1.39, 0; and region Z R eff = 2.99, 0.65. Time-varying reproduction numbers (R t ), which are attained by SI of onset dates, are decreasing with time. Region H reached its highest R t = 2.8 on July 29 and decreased to R t < 1 after August 4; region P reached its highest R t = 5.8 on September 9 and dropped to R t < 1 by September 14; region X had a fluctuation in the R t and R t < 1 after September 22; R t in region Z reached a maximum of 1.8 on September 15 and decreased continuously to R t < 1 on September 19.
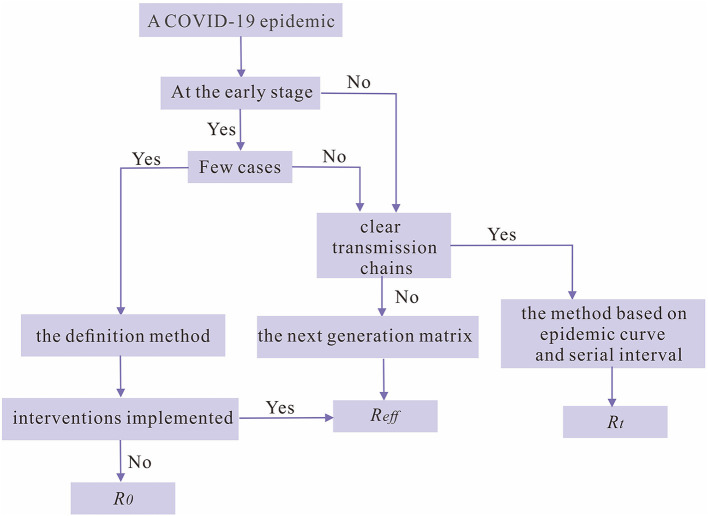
Conclusion: The reproduction number obtained by the definition method is optimal in the early stage of epidemics with a small number of cases that have clear transmission chains to predict the trend of epidemics accurately. The effective reproduction number R eff , calculated by the next generation matrix, could assess the scale of the epidemic and be used to evaluate the effectiveness of prevention and control measures used in epidemics with a large number of cases. Time-varying reproduction number R t , obtained via epidemic curve and SI, can give a clear picture of the change in transmissibility over time, but the conditions of use are more rigorous, requiring a greater sample size and clear transmission chains to perform the calculation. The rational use of the three methods for reproduction numbers plays a role in the further study of the transmissibility of COVID-19.
Keywords: COVID-19; definition methods; next generation matrix; reproduction number (R); serial interval (SI).
Copyright © 2023 Abudunaibi, Liu, Guo, Zhao, Rui, Song, Wang, Chen, Frutos, Su and Chen.
Conflict of interest statement
The authors declare that the research was conducted in the absence of any commercial or financial relationships that could be construed as a potential conflict of interest.
Figures
Similar articles
-
Comparison of epidemiological characteristics and transmissibility of different strains of COVID-19 based on the incidence data of all local outbreaks in China as of March 1, 2022.Front Public Health. 2022 Sep 15;10:949594. doi: 10.3389/fpubh.2022.949594. eCollection 2022. Front Public Health. 2022. PMID: 36187650 Free PMC article.
-
Nine-month Trend of Time-Varying Reproduction Numbers of COVID-19 in West of Iran.J Res Health Sci. 2021 Jun 28;21(2):e00517. doi: 10.34172/jrhs.2021.54. J Res Health Sci. 2021. PMID: 34465640 Free PMC article.
-
Angular reproduction numbers improve estimates of transmissibility when disease generation times are misspecified or time-varying.Proc Biol Sci. 2023 Sep 27;290(2007):20231664. doi: 10.1098/rspb.2023.1664. Epub 2023 Sep 27. Proc Biol Sci. 2023. PMID: 37752839 Free PMC article.
-
Digital contact tracing technologies in epidemics: a rapid review.Cochrane Database Syst Rev. 2020 Aug 18;8(8):CD013699. doi: 10.1002/14651858.CD013699. Cochrane Database Syst Rev. 2020. PMID: 33502000 Free PMC article.
-
A comparative study of effective atomic number calculations for dual-energy CT.Med Phys. 2021 Oct;48(10):5908-5923. doi: 10.1002/mp.15166. Epub 2021 Aug 25. Med Phys. 2021. PMID: 34390593 Review.
Cited by
-
SARS-CoV-2 Variants: Genetic Insights, Epidemiological Tracking, and Implications for Vaccine Strategies.Int J Mol Sci. 2025 Jan 31;26(3):1263. doi: 10.3390/ijms26031263. Int J Mol Sci. 2025. PMID: 39941026 Free PMC article. Review.
References
-
- World Health Organization . WHO Coronavirus Disease (COVID-19) Dashboard. Available online at: https://www.who.int/emergencies/diseases/novel-coronavirus-2019 (accessed September 26, 2022).
LinkOut - more resources
Full Text Sources