

Stellate cell expression of SPARC-related modular calcium-binding protein 2 is associated with human non-alcoholic fatty liver disease severity
- PMID: 36687468
- PMCID: PMC9850195
- DOI: 10.1016/j.jhepr.2022.100615
Stellate cell expression of SPARC-related modular calcium-binding protein 2 is associated with human non-alcoholic fatty liver disease severity
Abstract
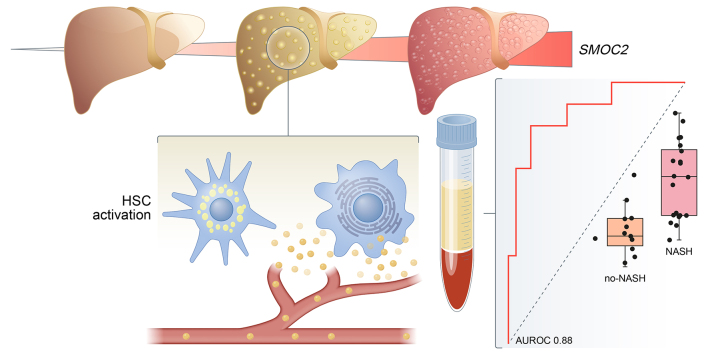
Background & aims: Histological assessment of liver biopsies is the gold standard for diagnosis of non-alcoholic steatohepatitis (NASH), the progressive form of non-alcoholic fatty liver disease (NAFLD), despite its well-established limitations. Therefore, non-invasive biomarkers that can offer an integrated view of the liver are needed to improve diagnosis and reduce sampling bias. Hepatic stellate cells (HSCs) are central in the development of hepatic fibrosis, a hallmark of NASH. Secreted HSC-specific proteins may, therefore, reflect disease state in the NASH liver and serve as non-invasive diagnostic biomarkers.
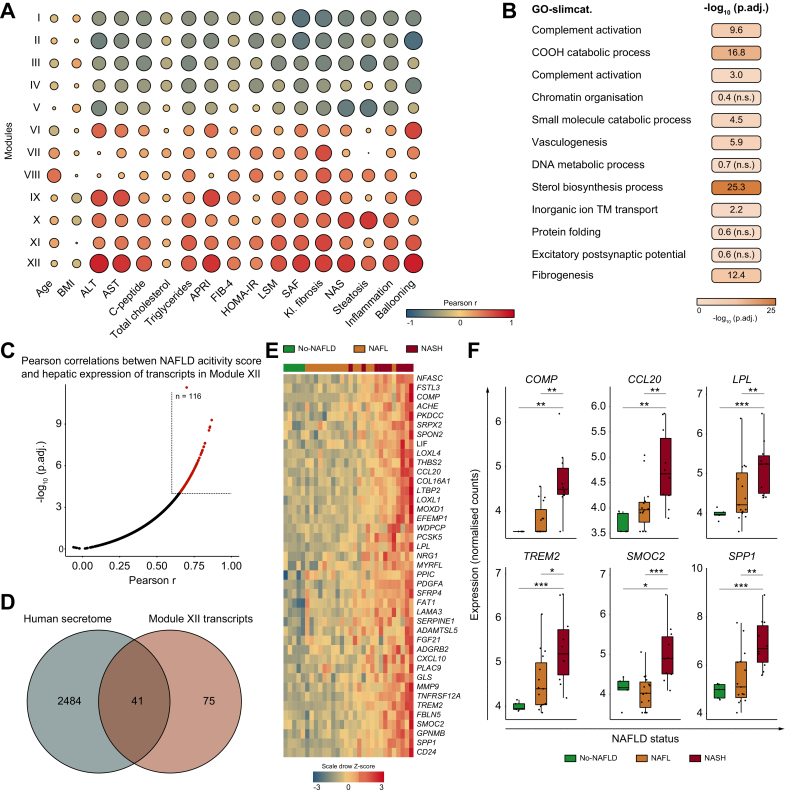
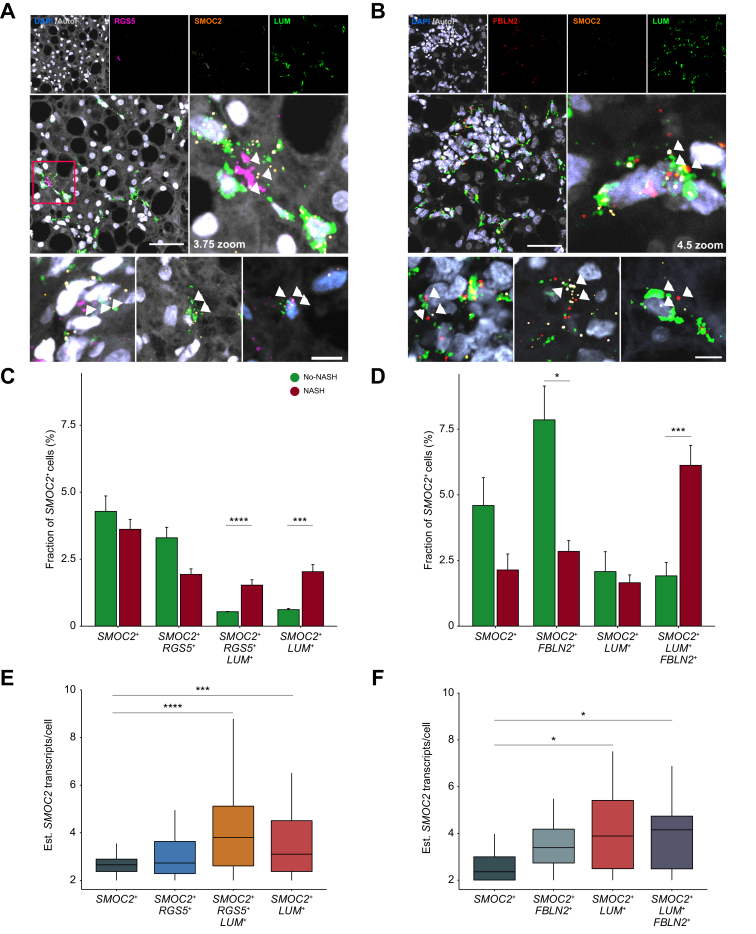
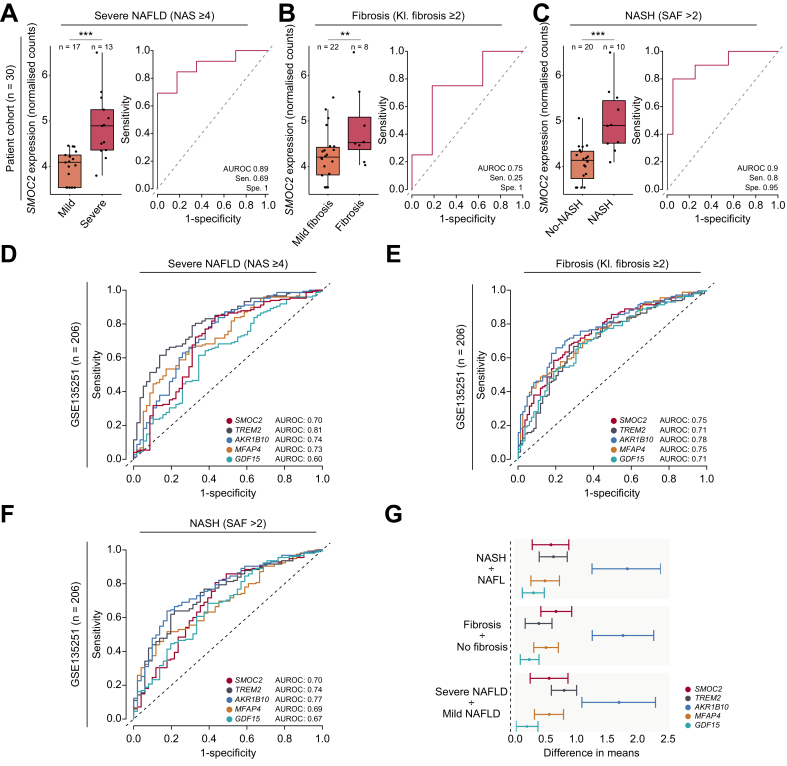
Methods: We performed RNA-sequencing on liver biopsies from a histologically characterised cohort of obese patients (n = 30, BMI >35 kg/m2) to identify and evaluate HSC-specific genes encoding secreted proteins. Bioinformatics was used to identify potential biomarkers and their expression at single-cell resolution. We validated our findings using single-molecule fluorescence in situ hybridisation (smFISH) and ELISA to detect mRNA in liver tissue and protein levels in plasma, respectively.
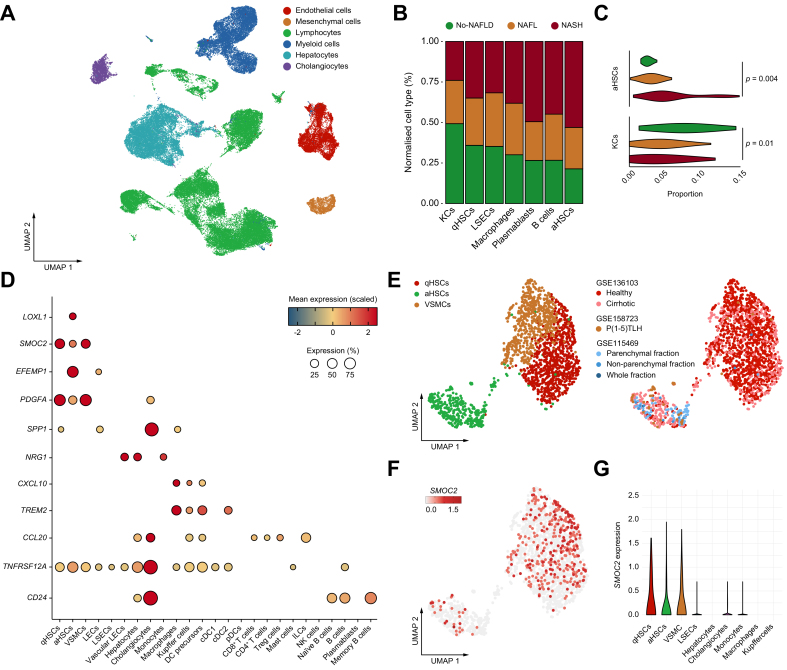
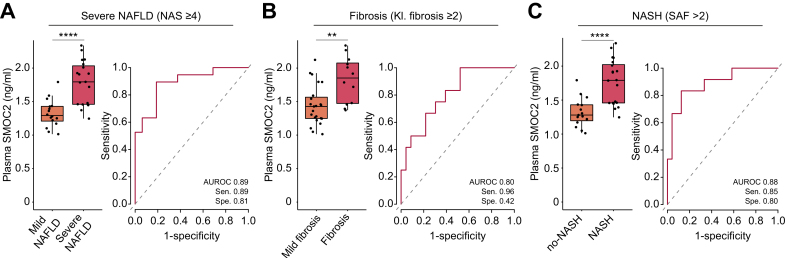
Results: Hepatic expression of SPARC-related modular calcium-binding protein 2 (SMOC2) was increased in NASH compared to no-NAFLD (p.adj <0.001). Single-cell RNA-sequencing data indicated that SMOC2 was primarily expressed by HSCs, which was validated using smFISH. Finally, plasma SMOC2 was elevated in NASH compared to no-NAFLD (p <0.001), with a predictive accuracy of AUROC 0.88.
Conclusions: Increased SMOC2 in plasma appears to reflect HSC activation, a key cellular event associated with NASH progression, and may serve as a non-invasive biomarker of NASH.
Impact and implications: Non-alcoholic fatty liver disease (NAFLD) and its progressive form, non-alcoholic steatohepatitis (NASH), are the most common forms of chronic liver diseases. Currently, liver biopsies are the gold standard for diagnosing NAFLD. Blood-based biomarkers to complement liver biopsies for diagnosis of NAFLD are required. We found that activated hepatic stellate cells, a cell type central to NAFLD pathogenesis, upregulate expression of the secreted protein SPARC-related modular calcium-binding protein 2 (SMOC2). SMOC2 was elevated in blood samples from patients with NASH and may hold promise as a blood-based biomarker for the diagnosis of NAFLD.
Keywords: AUROC, area under the receiver operating characteristic curve; ECM, extracellular matrix; HSC, hepatic stellate cells; LSM, liver stiffness measurement; MCP, matricellular protein; NAFL, non-alcoholic fatty liver; NAFLD; NAFLD, non-alcoholic fatty liver disease; NAS, NAFLD activity score; NASH; PCA, principal component analysis; SAF, steatosis, activity, and fibrosis; SE, sensitivity; SMOC2; SMOC2, SPARC-related modular calcium-binding protein 2; SP, specificity; SPARC, secreted protein acidic and cysteine-rich; VSMCs, vascular smooth muscle cells; WGCNA, weighted gene co-expression network analysis; aHSC, activated HSC; hepatic stellate cells; non-invasive biomarker; qHSC, quiescent HSC; smFISH, single-molecule fluorescence in situ hybridisation; transcriptomics.
© 2022 The Author(s).
Conflict of interest statement
All authors declare that they have no conflicts of interest. Please refer to the accompanying ICMJE disclosure forms for further details.
Figures
Similar articles
-
Prospective comparison of transient elastography, MRI and serum scores for grading steatosis and detecting non-alcoholic steatohepatitis in bariatric surgery candidates.JHEP Rep. 2021 Sep 30;3(6):100381. doi: 10.1016/j.jhepr.2021.100381. eCollection 2021 Dec. JHEP Rep. 2021. PMID: 34786549 Free PMC article.
-
Macrophage-derived thrombospondin 1 promotes obesity-associated non-alcoholic fatty liver disease.JHEP Rep. 2020 Oct 9;3(1):100193. doi: 10.1016/j.jhepr.2020.100193. eCollection 2021 Feb. JHEP Rep. 2020. PMID: 33294831 Free PMC article.
-
Increased serum miR-193a-5p during non-alcoholic fatty liver disease progression: Diagnostic and mechanistic relevance.JHEP Rep. 2021 Nov 25;4(2):100409. doi: 10.1016/j.jhepr.2021.100409. eCollection 2022 Feb. JHEP Rep. 2021. PMID: 35072021 Free PMC article.
-
Roles of hepatic stellate cells in NAFLD: From the perspective of inflammation and fibrosis.Front Pharmacol. 2022 Oct 13;13:958428. doi: 10.3389/fphar.2022.958428. eCollection 2022. Front Pharmacol. 2022. PMID: 36313291 Free PMC article. Review.
-
Role of G Protein-Coupled Receptors in Hepatic Stellate Cells and Approaches to Anti-Fibrotic Treatment of Non-Alcoholic Fatty Liver Disease.Front Endocrinol (Lausanne). 2021 Dec 6;12:773432. doi: 10.3389/fendo.2021.773432. eCollection 2021. Front Endocrinol (Lausanne). 2021. PMID: 34938271 Free PMC article. Review.
Cited by
-
Hepatic SPARC Expression Is Associated with Inflammasome Activation during the Progression of Non-Alcoholic Fatty Liver Disease in Both Mice and Morbidly Obese Patients.Int J Mol Sci. 2023 Oct 2;24(19):14843. doi: 10.3390/ijms241914843. Int J Mol Sci. 2023. PMID: 37834291 Free PMC article.
-
Obese Patients With Nonalcoholic Fatty Liver Disease Have an Increase in Soluble Plasma CD163 and a Concurrent Decrease in Hepatic Expression of CD163.Gastro Hep Adv. 2023 Mar 8;2(5):711-720. doi: 10.1016/j.gastha.2023.03.006. eCollection 2023. Gastro Hep Adv. 2023. PMID: 39129874 Free PMC article.
-
Single-cell transcriptomics reveals over-activated reactive oxygen species pathway in hepatocytes in the development of hepatocellular carcinoma.Sci Rep. 2024 Nov 30;14(1):29809. doi: 10.1038/s41598-024-81481-0. Sci Rep. 2024. PMID: 39616235 Free PMC article.
-
ADRB2 serves as a novel biomarker and attenuates alcoholic hepatitis via the SIRT1/PGC-1α/PPARα pathway: integration of WGCNA, machine learning and experimental validation.Front Pharmacol. 2024 Nov 21;15:1423031. doi: 10.3389/fphar.2024.1423031. eCollection 2024. Front Pharmacol. 2024. PMID: 39640486 Free PMC article.
-
Comprehensive meta-analysis reveals distinct gene expression signatures of MASLD progression.Life Sci Alliance. 2024 Apr 2;7(6):e202302517. doi: 10.26508/lsa.202302517. Print 2024 Jun. Life Sci Alliance. 2024. PMID: 38565287 Free PMC article.
References
-
- Organization WH . WHO Regional Office for Europe; Copenhagen: 2022. WHO European regional obesity report 2022. World Health Organization; 2022.
-
- Younossi Z.M., Golabi P., de Avila L., Paik J.M., Srishord M., Fukui N., et al. The global epidemiology of NAFLD and NASH in patients with type 2 diabetes: a systematic review and meta-analysis. J Hepatol. 2019;71:793–801. - PubMed
-
- Hagstrom H., Nasr P., Ekstedt M., Hammar U., Widman L., Stal P., et al. Health care costs of patients with biopsy-confirmed nonalcoholic fatty liver disease are nearly twice those of matched controls. Clin Gastroenterol Hepatol. 2020;18:1592–1599 e1598. - PubMed
-
- Matteoni C.A., Younossi Z.M., Gramlich T., Boparai N., Liu Y.C., McCullough A.J. Nonalcoholic fatty liver disease: a spectrum of clinical and pathological severity. Gastroenterology. 1999;116:1413–1419. - PubMed
LinkOut - more resources
Full Text Sources
Molecular Biology Databases
Miscellaneous
