

Spatial molecular and cellular determinants of STAT3 activation in liver fibrosis progression in non-alcoholic fatty liver disease
- PMID: 36687470
- PMCID: PMC9850198
- DOI: 10.1016/j.jhepr.2022.100628
Spatial molecular and cellular determinants of STAT3 activation in liver fibrosis progression in non-alcoholic fatty liver disease
Abstract
Background & aims: The prevalence of non-alcoholic fatty liver disease (NAFLD) and its severe form, non-alcoholic steatohepatitis (NASH), is increasing. Individuals with NASH often develop liver fibrosis and advanced liver fibrosis is the main determinant of mortality in individuals with NASH. We and others have reported that STAT3 contributes to liver fibrosis and hepatocellular carcinoma in mice.
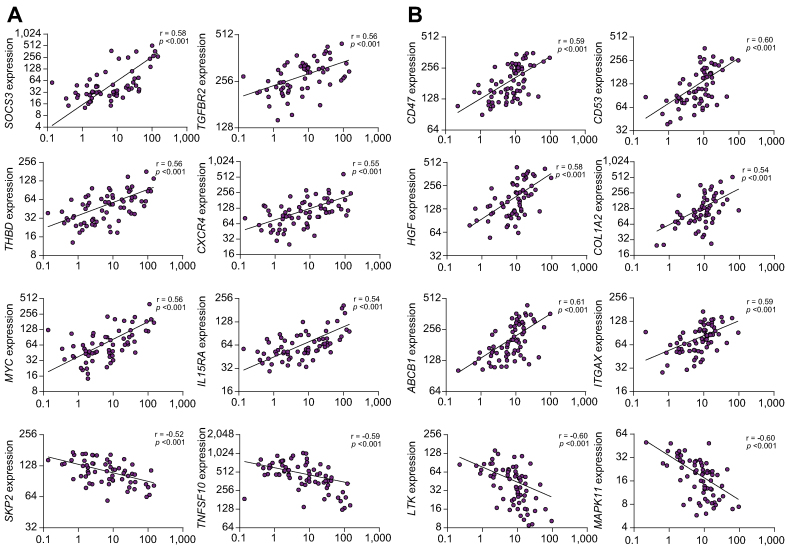
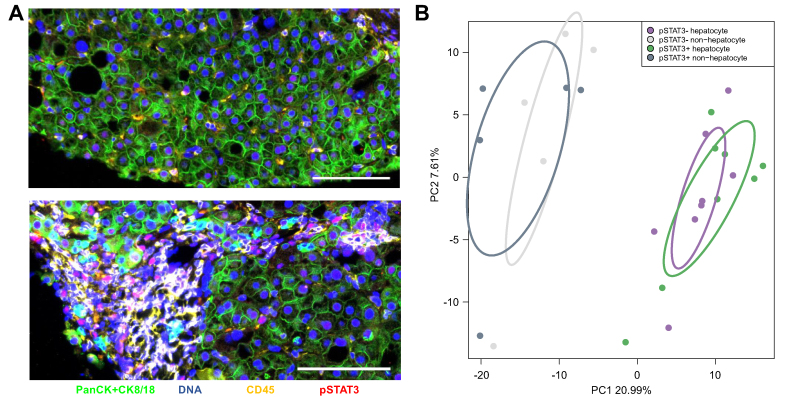
Methods: Here, we explored whether STAT3 activation in hepatocyte and non-hepatocyte areas, measured by phospho-STAT3 (pSTAT3), is associated with liver fibrosis progression in 133 patients with NAFLD. We further characterized the molecular and cellular determinants of STAT3 activation by integrating spatial distribution and transcriptomic changes in fibrotic NAFLD livers.Results: pSTAT3 scores in non-hepatocyte areas progressively increased with fibrosis severity (r = 0.53, p <0.001). Correlation analyses between pSTAT3 scores and expression of 1,540 immune- and cancer-associated genes revealed a large effect of STAT3 activation on gene expression changes in non-hepatocyte areas and confirmed a major role for STAT3 activation in fibrogenesis. Digital spatial transcriptomic profiling was also performed on 13 regions selected in hepatocyte and non-hepatocyte areas from four NAFLD liver biopsies with advanced fibrosis, using a customized panel of markers including pSTAT3, PanCK+CK8/18, and CD45. The regions were further segmented based on positive or negative pSTAT3 staining. Cell deconvolution analysis revealed that activated STAT3 was enriched in hepatic progenitor cells (HPCs) and sinusoidal endothelial cells. Regression of liver fibrosis upon STAT3 inhibition in mice with NASH resulted in a reduction of HPCs, demonstrating a direct role for STAT3 in HPC expansion.
Conclusion: Increased understanding of the spatial dependence of STAT3 signaling in NASH and liver fibrosis progression could lead to novel targeted treatment approaches.
Impact and implications: Advanced liver fibrosis is the main determinant of mortality in patients with NASH. This study showed using liver biopsies from 133 patients with NAFLD, that STAT3 activation in non-hepatocyte areas is strongly associated with fibrosis severity, inflammation, and progression to NASH. STAT3 activation was enriched in hepatic progenitor cells (HPCs) and sinusoidal endothelial cells (SECs), as determined by innovative technologies interrogating the spatial distribution of pSTAT3. Finally, STAT3 inhibition in mice resulted in reduced liver fibrosis and depletion of HPCs, suggesting that STAT3 activation in HPCs contributes to their expansion and fibrogenesis in NAFLD.
Keywords: DSP, digital spatial profiler; FC, fold change; HCC, hepatocellular carcinoma; HFD, high-fat diet; HPCs, hepatic progenitor cells; HSCs, hepatic stellate cells; IPA, Ingenuity® Pathway Analysis; LSECs, liver sinusoidal endothelial cells; NAFLD; NAFLD, non-alcoholic fatty liver disease; NAS, NAFLD activity score; NASH; NASH, non-alcoholic steatohepatitis; SECs, sinusoidal endothelial cells; STAT, signal transducer and activator of transcription; STAT3; cirrhosis; fibrosis; liver cancer; pSTAT3, phospho-STAT3.
© 2022 The Author(s).
Conflict of interest statement
The authors declare no conflicts of interest that pertain to this work. Please refer to the accompanying ICMJE disclosure forms for further details.
Figures


References
-
- Younossi Z.M., Stepanova M., Younossi Y., Golabi P., Mishra A., Rafiq N., et al. Epidemiology of chronic liver diseases in the USA in the past three decades. Gut. 2020;69:564–568. - PubMed
-
- Younossi Z.M., Stepanova M., Ong J., Trimble G., AlQahtani S., Younossi I., et al. Nonalcoholic steatohepatitis is the most rapidly increasing indication for liver transplantation in the United States. Clin Gastroenterol Hepatol. 2021;19:580–589 e585. - PubMed
-
- Powell E.E., Wong V.W., Rinella M. Non-alcoholic fatty liver disease. Lancet. 2021;397:2212–2224. - PubMed
-
- Taylor R.S., Taylor R.J., Bayliss S., Hagstrom H., Nasr P., Schattenberg J.M., et al. Association between fibrosis stage and outcomes of patients with nonalcoholic fatty liver disease: a systematic review and meta-analysis. Gastroenterology. 2020;158:1611–1625 e1612. - PubMed
Grants and funding
LinkOut - more resources
Full Text Sources
Research Materials
Miscellaneous
