. 2023 Jan 4:16:1060189.
doi: 10.3389/fncel.2022.1060189. eCollection 2022.

Neurotransmitter content heterogeneity within an interneuron class shapes inhibitory transmission at a central synapse

Affiliations

Neurotransmitter content heterogeneity within an interneuron class shapes inhibitory transmission at a central synapse

Dimitri Dumontier et al. Front Cell Neurosci. .

Abstract

Neurotransmitter content is deemed the most basic defining criterion for neuronal classes, contrasting with the intercellular heterogeneity of many other molecular and functional features. Here we show, in the adult mouse brain, that neurotransmitter content variegation within a neuronal class is a component of its functional heterogeneity. Golgi cells (GoCs), the well-defined class of cerebellar interneurons inhibiting granule cells (GrCs), contain cytosolic glycine, accumulated by the neuronal transporter GlyT2, and GABA in various proportions. By performing acute manipulations of cytosolic GABA and glycine supply, we find that competition of glycine with GABA reduces the charge of IPSC evoked in GrCs and, more specifically, the amplitude of a slow component of the IPSC decay. We then pair GrCs recordings with optogenetic stimulations of single GoCs, which preserve the intracellular transmitter mixed content. We show that the strength and decay kinetics of GrCs IPSCs, which are entirely mediated by GABAA receptors, are negatively correlated to the presynaptic expression of GlyT2 by GoCs. We isolate a slow spillover component of GrCs inhibition that is also affected by the expression of GlyT2, leading to a 56% decrease in relative charge. Our results support the hypothesis that presynaptic loading of glycine negatively impacts the GABAergic transmission in mixed interneurons, most likely through a competition for vesicular filling. We discuss how the heterogeneity of neurotransmitter supply within mixed interneurons like the GoC class may provide a presynaptic mechanism to tune the gain of microcircuits such as the granular layer, thereby expanding the realm of their possible dynamic behaviors.

Keywords: cerebellum; co-transmission; golgi cells; granule cells; inhibition.


Conflict of interest statement

SD is a stakeholder of the SME Karthala System and an inventor of IP licensed to this company. The remaining authors declare that the research was conducted in the absence of any commercial or financial relationships that could be construed as a potential conflict of interest.

Figures
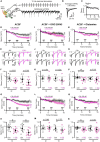
FIGURE 1
FIGURE 1
Manipulation of GABA and glycine supply to GoCs affect GrCs inhibition. (A) Left, schematic of the experiment. GABAergic IPSCs recorded from GrCs in whole cell configuration are evoked by the continue electrical stimulation (eIPSC) at 10 Hz of GlyT2(−) and GlyT2(+) GoCs axons without any distinction. Right, a GrC recording during 10 Hz stimulation of the GoCs axons. GABAergic eIPSCs have been pharmacologically isolated with the following cocktail of blockers: APV 50 μM, NBQX 2 μM, strychnine 0.5 μM, CGP55845 1 μM, and ORG24598 1 μM. (B) Average of 100 consecutive GrC eIPSCs following the electrical stimulation. The strength of the GABAergic transmission over the time is estimated by taking the charge (QeIPSC, gray area) of the averaged eIPSCs every 10 s. (C) Example of the QeIPSC over the time. Each dot was normalized by the mean signal in the baseline (3 min from the beginning, full dots). (D) Populational evolution of the GABAergic transmission over the time in ACSF (ctrl, black, n = 8–10) or ASCF + glycine 100 μM for 5 min (+Gly, pink, n = 10). Traces represent the mean normalized charge ± SEM. (E) Average of 1000 eIPSCs at t1, t2, and t3 in ctrl (black) and with glycine application (pink). Two representative pairs are shown for each condition. (F) Charge measured from 1000 consecutive eIPSCs averaged at the end of the glycine application (t2) and at the end of the recordings (washout, t3), normalized by the baseline (t1). (G,H) Same as panels (D,F) using the charge to peak ratio (QeIPSC/IeIPSC). (I–M) Same as panels (D–H) in presence of ORG25543 1 μM, the specific blocker of GlyT2 (ctrl n = 7, +Gly n = 6–7). (N–R) Same as panels (D–M) in ACSF supplemented with 500 μM of Glutamine (Gln), the precursor of the GABA synthesis (ctrl n = 11–15, +Gly n = 11). *p < 0.05.
FIGURE 2
FIGURE 2
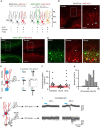
A targeted optogenetic stimulation strategy for GoC-GrC paired recordings without presynaptic dialysis. (A) Schematic of the viral strategies to express the channelrhodopsin (ChR2) fused with the tdTomato as reporter in GlyT2(+) and GlyT2(−) GoCs. GCL, granular layer; PCL, Purkinje cells layer; ML, molecular layer. (B) Slice of a representative GlyT2-Cre mouse injected with the mix 1 of AAV. Left panel, apex of the lobule IV showing infected, tdTomato(+) GoCs. Scale bar: 100 μm. Right panel left panel magnification showing the characteristic GoCs morphology. Arrowhead: soma; arrow: apical dendrite; double arrow: axons. Scale bar: 20 μm. (C) Same as panel (B) for a GlyT2-eGFP mouse injected with the mix 2 of AAV. Scale bar: 100 μm. (D) Magnification of panel (C). (#2 and #3): GlyT2(+) GoC; (#4): GlyT2(−) GoC. Scale bar: 20 μm. (E) Left panel, calibration of the optogenetic stimulation power (in blue) to reach >80% of AP success (Threshold stimulation). Right panel, threshold stimulation power at the soma, dendrites, and axons of a representative GlyT2-Cre(+) GoC. Insert, magnification of an AP evoked at the soma. (F) Populational distribution of the threshold stimulation power (dendrites n = 13, soma n = 18, axons n = 10). In red, mean power at the soma ±2 SD. (G) Histogram of AP success rate evoked by somatic subthreshold stimulation in connected and unconnected GlyT2(+) and GlyT2(−) GoCs (n = 64). (H) Schematic of the GoC-GrC optogenetic pairs recording of the GABAergic transmission in cerebellar glomeruli (gray dotted circle). (I) Representative example of a specifically connected GoC-GrC pair.
FIGURE 3
FIGURE 3
GlyT2(–) and GlyT2(+) GoC-GrC connections have different synaptic properties. (Ai) Illustration of the charge measurement in GrCs recordings before (gray) and after optogenetic stimulation evoking GoCs AP (blue). Dotted rectangles represent the local 10 ms normalization windows (see materials and method). (Aii) Cumulative probability distribution of the baseline (gray) and post-AP (blue) charges from a representative unconnected pair. (Aiii) Same as panel (Aii) for a representative connected pair. (B) Average GrCs traces following optogenetically evoked AP in GyT2(–) (red, n = 10) and GlyT2(+) (green, n = 28) GoCs. These traces will be referred as AP(+) from here and IAP(+) is the peak amplitude of the averaged AP(+) traces. (C) Violin plot distribution of IAP(+) of GlyT2(–) and GlyT2(+) pairs shown in panel (B). The “#” symbolized the significative result from the Conover test of variance. (D) Same representation as panels (Aii, Aiii), showing the transmission failure threshold of a representative connected pair (dotted yellow line). Right insert, resulting classification of the example traces in transmission success or failure with the corresponding average (black). (E) Cumulative distribution probability of the transmission success peak amplitude for each GoC-GrC pairs. These curves show that GlyT2(–) pairs are more right shifted than the GlyT2(+) ones, but no significant differences emerge with this metric cleaned of transmission failure [GlyT2(–): 80.78 ± 51.75 pA, n = 10; GlyT2(+): 53.94 ± 23.75 pA, n = 28; p = 0.3]. (F) Transmission failure probability in function of the IAP(+) for all connected pairs (n = 38). (G) Schematic illustrating the consequence of indirect GoC-GrC connection through Gap junction on the synaptic delay. (H) Transmission failure probability in function of the synaptic delay (peak-to-peak time between AP and IAP(+); GlyT2(–): 1.57 ± 0.072 ms, n = 10; GlyT2(+): 1.49 ± 0.133 ms, n = 28; p = 0.04). (I) Violin plot distribution of failure probability showing a bimodal distribution for GlyT2(–) GoCs pairs and a continue one for GlyT2(+) ones. (J) Histogram of the inertia for 2 clusters K-mean analysis on bootstrap distribution of GlyT2(+) failure probability distribution (green). The red dot is the inertia of GlyT2(–) 2 clusters K-mean analysis on the distribution shown in panel (I). This figure shows how likely 8 points draw randomly with replace from the GlyT2(+) distribution give rise to a distribution as separated as the GlyT2(–) one.
FIGURE 4
FIGURE 4
Different types of IPSCs unravel decreased and variable GABA transient at GlyT2(+) synapses. (A) Example of GlyT2(−) and GlyT2(+) AP(+) averaged traces both adjusted by a bi-exponential function. The two decay components have a fast (black) and a slow (blue) time constant named TAU1 and TAU2, respectively. (B) Correlation between the two fitted time constants in connected GoC-GrC pairs [n = 36, GlyT2(−) n = 10, GlyT2(+) n = 26]. The two dots outlined in black are the individual examples in panel (A). GlyT2(−): TAU1 = 2.04 ± 0.51 ms, TAU2 = 16.56 ± 2.73 ms, n = 10; GlyT2(+): TAU1 = 1.94 ± 0.62 ms, TAU2 = 16.41 ± 7.17 ms, n = 26; TAU1 GlyT2(−) vs. TAU1 GlyT2(+), p = 0.46, TAU2 GlyT2(−) vs. TAU2 GlyT2(+), p = 0.58. (C) Violin plot distribution of the synaptic charge [QAP(+)] calculated from bi-exponential fit (A1*TAU1 + A2*TAU2) of mean AP(+) current. The “#” indicates a significant difference for the Conover test of variance. (D) Violin plot distribution of the ratio between QAP(+) and the peak amplitude of AP(+) current [IAP(+)] (Figure 2B). (E) Mean peak-normalized AP(+) current of the GlyT2(−) and GlyT2(+) pairs (n = 10 and n = 28, respectively). The superposed blue traces are the second decay component from the bi-exponential function [same fitting procedure as panel (A)]. (F) Transmission success from a representative pair decomposed in phasic (average trace in black) and delayed (average trace in orange) events (see details in section Materials and methods). (G) Examples exhibiting kinetics difference of phasic and delayed events (left: average traces; right: peak-normalized traces). (H) Average phasic and delayed IPSC of a pair adjusted with a bi- and a mono-exponential function reciprocally. In blue, the second decay component of the phasic IPSC (TAU2phasic) and the single decay component of the delayed IPSC (TAUdelayed). The areas shaded in gray represent the charge of the corresponding decay component in phasic (Q2phasic = A2*TAU2phasic) and delayed (Qdelayed = A*TAUdelayed) events. The peak amplitude of the phasic IPSC (Iphasic) did not differ significantly between GlyT2(+) and GlyT2(−) pairs. (I) Correlation between Q2phasic and Qdelayed. (J) Correlation between the decay time constant of delayed IPSCs (TAUdelayed) and the second one of phasic IPSCs (TAU2phasic). (I,J) The gray dotted lines are diagonals, and exhibit a lack of charges and time in delayed IPSCs compared to the phasic ones. (K) Correlation between Iphasic and Qdelayed in the GlyT2(−) and GlyT2(+) population. In black the correlation of all pairs pooled together (slope = 1.2 ms, r = 0.66, p < 0.0001, n = 31). (L) Violin plot distribution of Qdelayed to Iphasic ratio for GlyT2(+) and GlyT2(−) pairs. These ratios are the slopes of each dot in panel (K) and depict that GlyT2(+) variability exceeds the one of GlyT2(−) pairs. *p < 0.05.
FIGURE 5
FIGURE 5
A stronger activation of high-affinity GABAAR by GlyT2(−) GoCs. (A) Full scale averaged IPSCs from GlyT2(−) and GlyT2(+) GoC-GrC paired recordings. Windows (1), (2), and (3) correspond to 20 ms of recording at 100, 200, and 300 ms from the IPSC peak, respectively. Insert shows the magnification of windows (1), (2), and (3) where the black dotted line represents 0 pA. (B) Cumulative sum (integral) of the mean AP(+) current for each GoC-GrC pairs (red = GlyT2(−), n = 10; green = GlyT2(+), n = 27). (C) Average integrals ± SEM for AP failure [AP(−)] or IPSC failure [AP(+) IPSC(−)] in connected (top, n = 24) and unconnected pairs (down, n = 18). (D) Slow component charges (Qslow) in AP(−) and AP(+) IPSC(−) mean current from connected (black, n = 24) and unconnected pairs (yellow, n = 18). (E) Violon plot distribution of Qslow AP(+) in GlyT2(+) (n = 25) and GlyT2(−) (n = 10) pairs. *p < 0.05.

Similar articles

Cited by

References

    1. Ahmadi S., Muth-Selbach U., Lauterbach A., Lipfert P., Neuhuber W. L., Zeilhofer H. U. (2003). Facilitation of spinal NMDA receptor currents by spillover of synaptically released glycine. Science 300 2094–2097. 10.1126/science.1083970 - DOI - PubMed
    1. Akazawa C., Shigemoto R., Bessho Y., Nakanishi S., Mizuno N. (1994). Differential expression of five N-methyl-D-aspartate receptor subunit mRNAs in the cerebellum of developing and adult rats. J. Comp. Neurol. 347 150–160. 10.1002/cne.903470112 - DOI - PubMed
    1. Ankri L., Husson Z., Pietrajtis K., Proville R., Léna C., Yarom Y., et al. (2015). A novel inhibitory nucleo-cortical circuit controls cerebellar Golgi cell activity. Elife 4:e06262. 10.7554/eLife.06262 - DOI - PMC - PubMed
    1. Apostolides P. F., Trussell L. O. (2013). Rapid, activity-independent turnover of vesicular transmitter content at a mixed glycine/GABA synapse. J. Neurosci. 33 4768–4781. 10.1523/JNEUROSCI.5555-12.2013 - DOI - PMC - PubMed
    1. Aubrey K. R., Rossi F. M., Ruivo R., Alboni S., Bellenchi G. C., Le Goff A., et al. (2007). The transporters GlyT2 and VIAAT cooperate to determine the vesicular glycinergic phenotype. J. Neurosci. 27 6273–6281. 10.1523/JNEUROSCI.1024-07.2007 - DOI - PMC - PubMed

LinkOut - more resources