

Potential therapeutic mechanism of deep brain stimulation of the nucleus accumbens in obsessive-compulsive disorder
- PMID: 36687525
- PMCID: PMC9845878
- DOI: 10.3389/fncel.2022.1057887
Potential therapeutic mechanism of deep brain stimulation of the nucleus accumbens in obsessive-compulsive disorder
Abstract
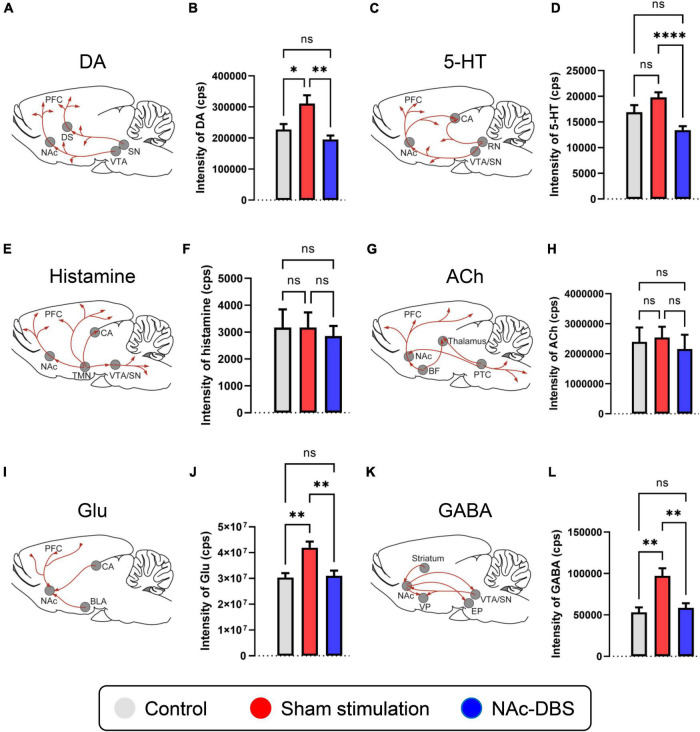
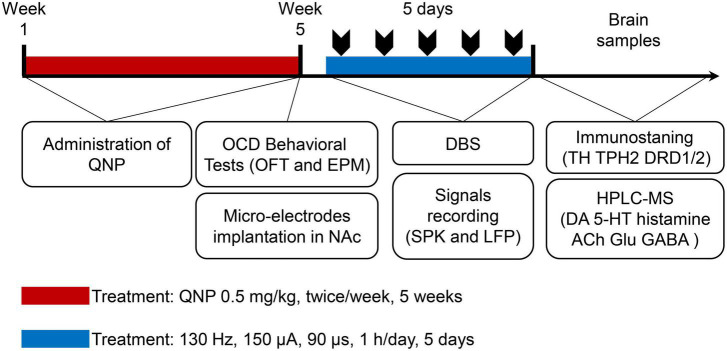
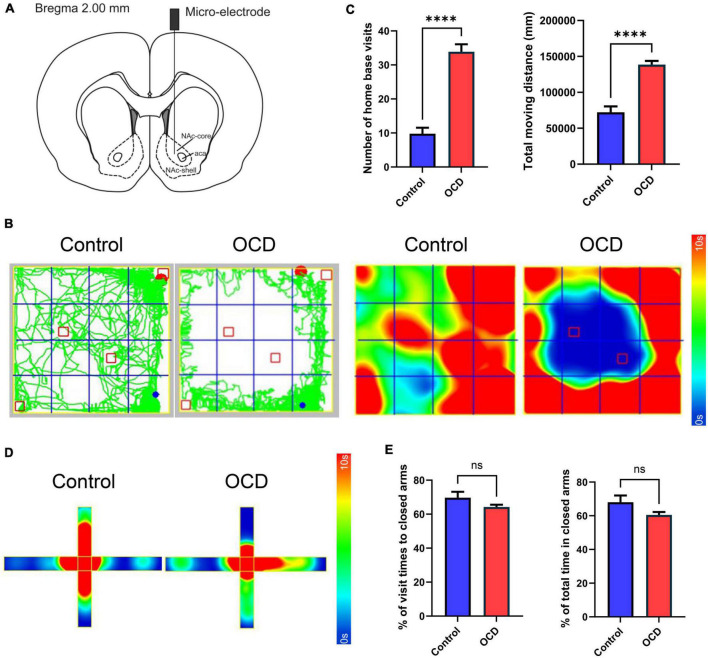
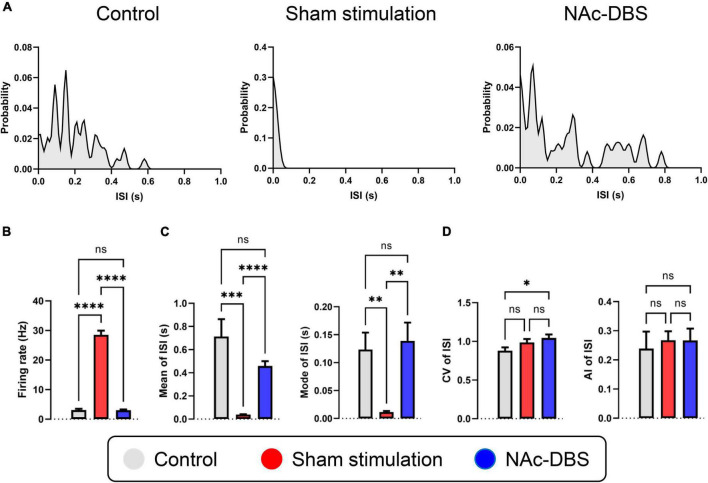
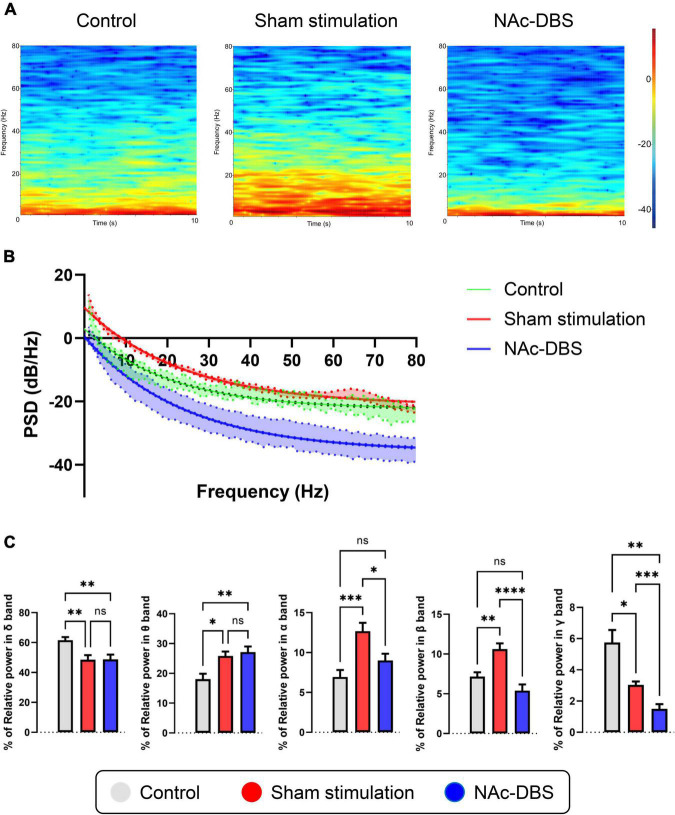
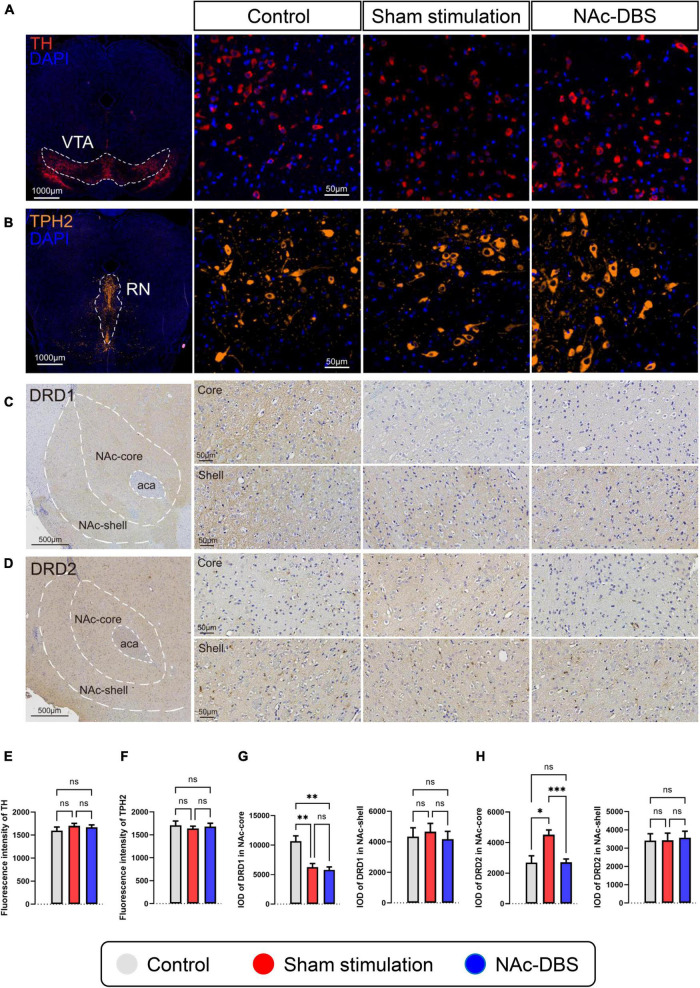
Deep brain stimulation (DBS) of the nucleus accumbens (NAc) (NAc-DBS) is an effective solution to refractory obsessive-compulsive disorder (OCD). However, evidence for the neurobiological mechanisms of OCD and the effect of NAc-DBS is still lacking. One hypothesis is that the electrophysiological activities in the NAc are modulated by DBS, and another hypothesis is that the activities of neurotransmitters in the NAc are influenced by DBS. To investigate these potential alterations, rats with quinpirole (QNP)- induced OCD were treated with DBS of the core part of NAc. Then, extracellular spikes (SPK) and local field potentials (LFP) in the NAc were recorded, and the levels of relevant neurotransmitters and related proteins were measured. Analysis of SPK revealed that the firing rate was decreased and the firing pattern was changed after NAc-DBS, and analysis of LFP showed that overall power spectral density (PSD) levels were reduced after NAc-DBS. Additionally, we found that the relative powers of the theta band, alpha band and beta band were increased in OCD status, while the relative powers of the delta band and gamma band were decreased. This pathological pattern of power distribution was reformed by NAc-DBS. Furthermore, we found that the local levels of monoamines [dopamine (DA) and serotonin (5-HT)] and amino acids [glutamate (Glu) and gamma-aminobutyric acid (GABA)] in the NAc were increased in OCD status, and that the expression of the two types of DA receptors in the NAc exhibited an opposite change. These abnormalities could be reversed by NAc-DBS. These findings provide a more comprehensive understanding about the function of the NAc in the pathophysiology of OCD and provide more detailed evidence for the potential effect of NAc-DBS.
Keywords: deep brain stimulation; electrophysiology in vivo; neurotransmitters; nucleus accumbens; obsessive-compulsive disorder; therapy.
Copyright © 2023 Shi, Wang, Xiao, Gui, Zheng, Bai, Su, Li, Xu, Pan, Zhang and Wang.
Conflict of interest statement
The authors declare that the research was conducted in the absence of any commercial or financial relationships that could be construed as a potential conflict of interest.
Figures
Similar articles
-
Use of differential stimulation of the nucleus accumbens and anterior limb of the internal capsule to improve outcomes of obsessive-compulsive disorder.J Neurosurg. 2023 May 26;139(5):1376-1385. doi: 10.3171/2023.4.JNS221824. Print 2023 Nov 1. J Neurosurg. 2023. PMID: 37243560
-
High-frequency deep brain stimulation of the nucleus accumbens region suppresses neuronal activity and selectively modulates afferent drive in rat orbitofrontal cortex in vivo.J Neurosci. 2007 Nov 14;27(46):12601-10. doi: 10.1523/JNEUROSCI.3750-07.2007. J Neurosci. 2007. PMID: 18003839 Free PMC article.
-
Nucleus accumbens deep brain stimulation produces region-specific alterations in local field potential oscillations and evoked responses in vivo.J Neurosci. 2009 Apr 22;29(16):5354-63. doi: 10.1523/JNEUROSCI.0131-09.2009. J Neurosci. 2009. PMID: 19386932 Free PMC article.
-
Therapeutic potential of deep brain stimulation of the nucleus accumbens in morbid obesity.Neurosurg Focus. 2018 Aug;45(2):E10. doi: 10.3171/2018.4.FOCUS18148. Neurosurg Focus. 2018. PMID: 30064329 Review.
-
Deep brain stimulation versus anterior capsulotomy for obsessive-compulsive disorder: a review of the literature.J Neurosurg. 2015 May;122(5):1028-37. doi: 10.3171/2014.11.JNS132618. Epub 2015 Jan 30. J Neurosurg. 2015. PMID: 25635480 Review.
Cited by
-
Neural oscillations in the ventral striatum reveal differences between the encoding of palatable food and ethanol consumption.Alcohol Clin Exp Res (Hoboken). 2023 Jul;47(7):1327-1340. doi: 10.1111/acer.15101. Epub 2023 Jun 4. Alcohol Clin Exp Res (Hoboken). 2023. PMID: 37166071 Free PMC article.
-
Mechanisms of nucleus accumbens deep brain stimulation in treating mental disorders.Fundam Res. 2024 Jul 6;5(1):48-54. doi: 10.1016/j.fmre.2024.06.009. eCollection 2025 Jan. Fundam Res. 2024. PMID: 40166085 Free PMC article. Review.
-
Dopamine Release Dynamics in the Nucleus Accumbens Are Modulated by the Timing of Electrical Stimulation Pulses When Applied to the Medial Forebrain Bundle and Medial Prefrontal Cortex.ACS Chem Neurosci. 2024 Jul 17;15(14):2643-2653. doi: 10.1021/acschemneuro.4c00115. Epub 2024 Jul 3. ACS Chem Neurosci. 2024. PMID: 38958080 Free PMC article.
-
Codes between Poles: Linking Transcriptomic Insights into the Neurobiology of Bipolar Disorder.Biology (Basel). 2024 Sep 30;13(10):787. doi: 10.3390/biology13100787. Biology (Basel). 2024. PMID: 39452096 Free PMC article.
References
-
- Ade K., Wan Y., Hamann H., O’Hare J., Guo W., Quian A., et al. (2016). Increased metabotropic glutamate receptor 5 signaling underlies obsessive-compulsive disorder-like behavioral and striatal circuit abnormalities in mice. Biol. Psychiatry 80 522–533. 10.1016/j.biopsych.2016.04.023 - DOI - PMC - PubMed
-
- Alam M., Heissler H., Schwabe K., Krauss J. (2012). Deep brain stimulation of the pedunculopontine tegmental nucleus modulates neuronal hyperactivity and enhanced beta oscillatory activity of the subthalamic nucleus in the rat 6-hydroxydopamine model. Exp. Neurol. 233 233–242. 10.1016/j.expneurol.2011.10.006 - DOI - PubMed
LinkOut - more resources
Full Text Sources